Trading volume is the best measurable indicator for determining the price level in the market, including the cryptocurrency market. Trading volume increases with the activity of traders and is able to influence the price trend by either strengthening it or changing its direction.
There are many different tools to measure volume, overbought and oversold conditions, etc. such as RSI, RVI, VO, and others. This article is about a similar indicator – Money Flow Index (MFI).
Professional traders consider the Money Flow Index Indicator to be one of the most popular technical analysis tools. There are many reasons for this. One of them is that it is inherently very informative when it comes to calculating the flow of funds invested in a particular asset. Today we will find out how useful this indicator is on the cryptocurrency market and will test different options for its application.
Article contents:
- What is the Money Flow Index (MFI)?
- How to use MFI?
- MFI vs RSI
- How to access MFI on FYBIT?
- Conclusion
What is the Money Flow Index (MFI)?
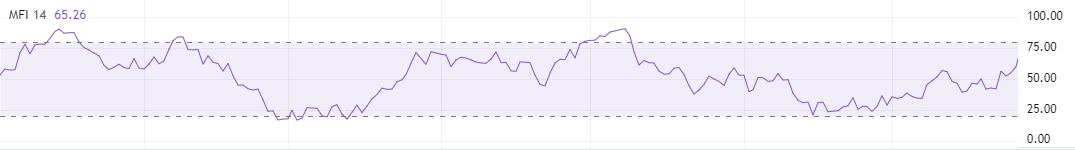
Money Flow Index (MFI) is a momentum indicator that measures the change in the flow of money into and out of an asset during a given period. It is very similar to the Relative Strength Index, but it has a different calculation that incorporates volume.
Money Flow defines positive money flow & negative money flow. The ratio of positive and negative money flow is then put into an RSI formula to produce an oscillator that ranges between zero and one hundred.
MFI is useful not only for identifying overbought and oversold levels but also for identifying reversals and price extremes.
MFI formula
Here you will learn step by step how the money flow indicator works and go into its formula so you can get a good idea and calculate the money flow yourself.
The rate of change of the indicator formula is similar to that used for the RSI indicator. To simplify the perception and clarity of the internal content of the MFI indicator, we present a step-by-step method for calculating its values:
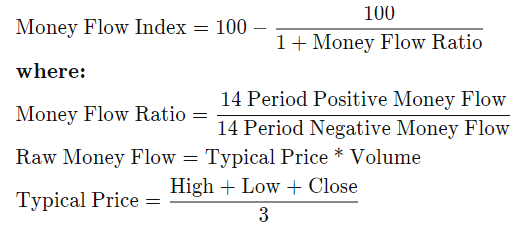
- The equation attempts to determine the “Typical Price” by taking the mean of the high, low, and closing prices for a particular period.
Typical Price = (H+L+C) / 3
2. The equation attempts to determine the Raw Money Flow (RMF). It takes the typical price and multiplies it by volume.
Raw Money Flow = TP x V
3. Here we define Money Ratio(MR); Positive Money Flow(PMF) & Negative Money Flow(NMF).
The indicator defines a positive money flow as any candle where the typical price is higher than the previous candle. Conversely, a negative money flow is given when the typical price of a candle is lower than the previous candle.
To determine the positive money flow for the indicator, you need to add up the total positive money flows over the relevant time period.
Of course, to determine the negative money flow for the indicator, you need to add up the total negative money flows over the same time period.
Money Ratio = PMF / NMF
4. Finally, everything is converted into an index with the following formula:
MFI = 100 – 100 / (1 + MR)
Here is a brief reminder of these formulas for the 14-day default period.
Positive Money Flow
Positive Money Flow – money flow invested in a particular asset that exceeds the previous period’s money flow.
If demand for a particular coin is high but supply is limited, prices will rise as supply increases.
This is the same as any other bidding process: If there are more people who want to own something, people will try to outbid each other.
The combination of these factors causes buying pressure or positive money flow.
Negative Money Flow
Negative Money Flow – money flow invested in a particular asset that does not exceed the previous period’s money flow.
When demand falls, sellers must lower prices to attract buyers. Therefore MFI will show negative money flow values and represent selling pressure for that period.
How to use MFI?
Now we come to the most interesting question – how to use this indicator in trading? Since the MFI is very similar to the RSI, it provides similar signals. These include overbought and oversold levels, divergences and pattern formations. All examples are taken from the BTC/USD chart.
Overbought and Oversold Levels
Since the Money Flow Index is a typical leading oscillator, the most common signal indicated by this technical analysis indicator is overbought or oversold conditions. Also, like all other oscillators, the Money Flow Index can get stuck in the zone for a long time when a trend starts. Therefore, the indicator needs additional technical filters to reveal trend change.
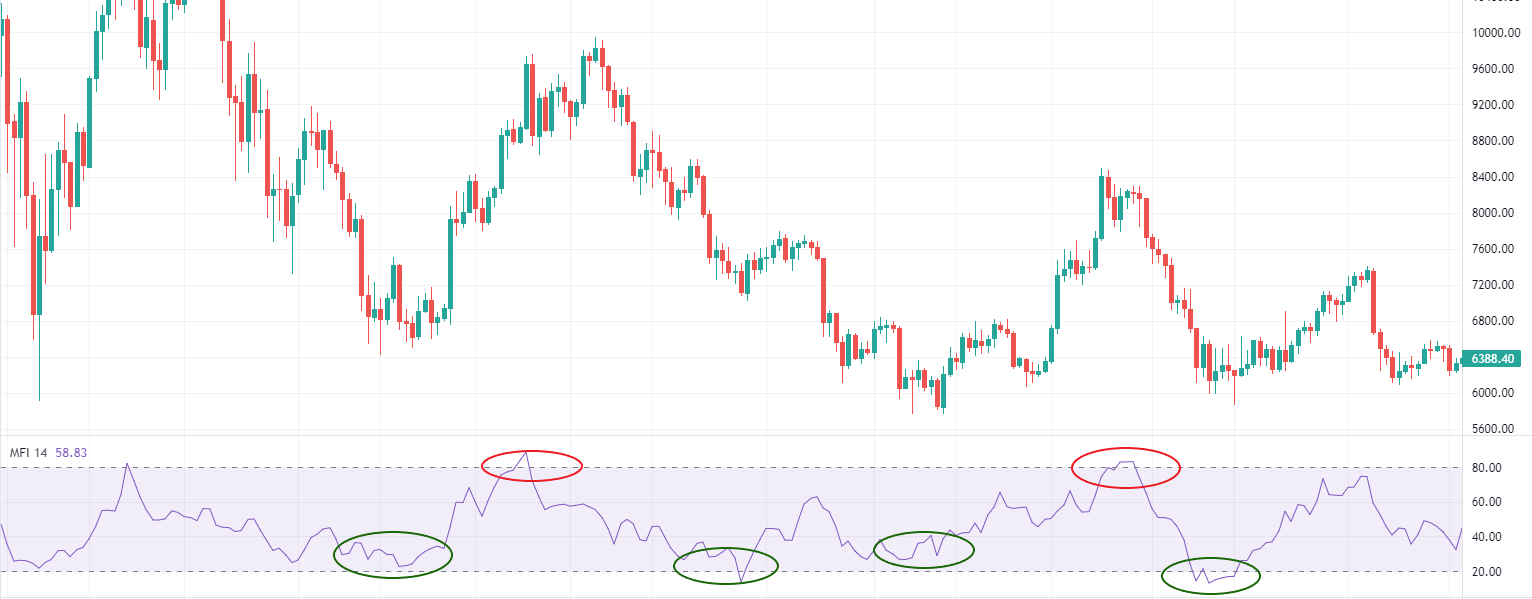
As you can see in the chart, there is a visible correlation between the price reversal and the overbought and oversold levels of the MFI oscillator.
The classic overbought area is considered overbought at 80 and above. The oversold area is considered oversold below 20. However, these values are subjective and you can set the thresholds that work best for your trading strategy.
Divergence
As you know, a divergence is nothing more than a divergence between the price chart and the indicator chart.
MFI divergence occurs when there is a difference between what the price move indicates and what the MFI indicates. These differences can signal an impending price reversal. There are two types of divergences in particular: bearish and bullish.
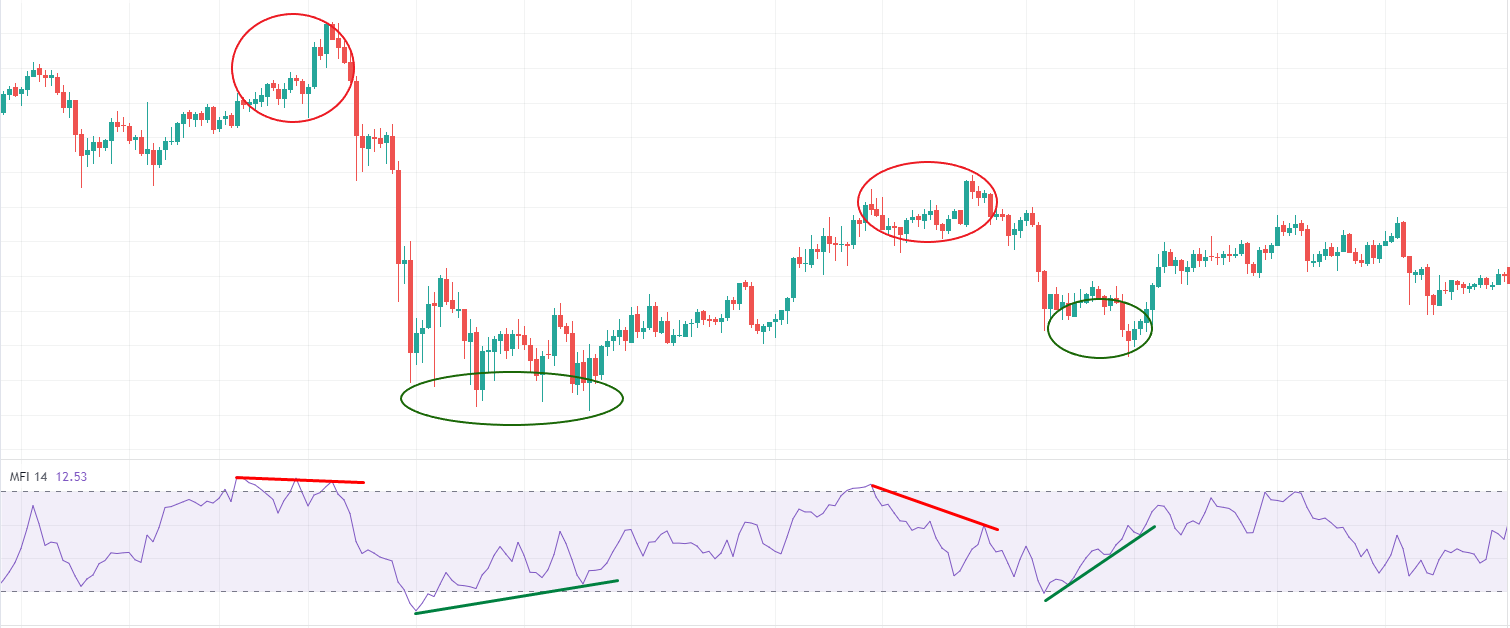
As you can see, the price chart shows two consecutive highs, while the indicator chart shows two highs at the same level. This tells us that the price has exhausted all the forces for its further growth.
The next price action shows a bullish divergence. After reversal and breaking the support zone, price and MFI values decline. Then the price makes a new low, MFI is in the oversold zone. When the price makes new lows again, the indicator cannot form the next low lower than the previous one, which leads to a buy signal.
Pattern formation
Most traders use this method with resistance and support levels, trends, and technical analysis patterns such as a double top or a head with shoulders. Signals that appear simultaneously on the indicator chart and the price chart are reliable. This trading method is quite specific, as a lot here depends on the subjective view of the trader and his interpretation of what is happening. I would just like to say that it is quite difficult to find a good pattern on the MFI chart.
MFI vs RSI
Money Flow Index and Relative Strength Index (RSI) are very similar indicators. The Relative Strength Index (RSI) also shows the strength and weakness of price movements. These tools are based on the closing price and identify overbought and oversold conditions that help traders find trading opportunities.
However, this is where the similarities between the two indicators end. The difference between the MFI and the RSI is that the latter does not take volume data into account. This means that both indicators look at different things that have accumulated during the respective period. While the MFI looks at volume, the RSI looks at price changes. For this reason, many refer to the MFI as the volume-weighted RSI. This basically means that the MFI is the more comprehensive indicator, even though the RSI is the more popular indicator.
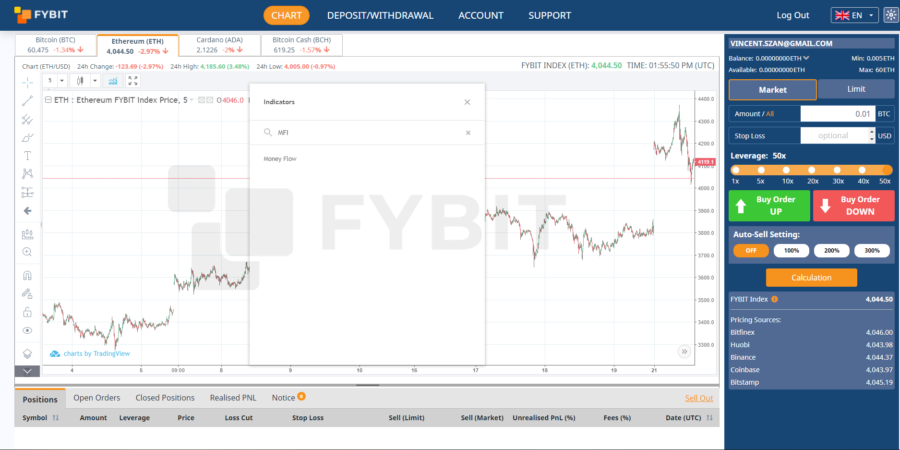
How to access MFI on FYBIT?
In order to access the Money Flow Index go to our main page and open the chart. Click the “Indicators” tab and enter “MFI” or “Money Flow”.
Most trading platforms usually have the same issues – lagging platforms or bots in the support team.
We recommend you our trading platform and hope you will enjoy it.
Conclusion
The Money Flow Index indicator is closely related to the RSI, plus the MFI incorporates volume. That also makes analyzing the current market situation with the Money Flow Index much easier. These are the reasons for its popularity.
The price of the financial instrument and its correlation with the Money Flow Index can be a very valuable tool. Of course, like any other indicator, you’d better not use the MFI as a standalone indicator. Since it is an oscillator, it is only logical to use it to determine the entry point, while the current trend is determined with trend indicators.
We hope this tool will help you maximize profits. Check Money Flow Index and trade with profit, good luck.