Stochastic indicator (also commonly called “Stochastic Oscillator”) is one of the basic indicators for technical analysis. It is used by many traders everywhere: at stock market and indices, currencies on the forex market, and crypto-assets. The main operating principle of Stochastic oscillator is to identify overbought and oversold levels. These levels are based on the jumps in price dynamics. This way Stochastic oscillator measures the upcoming trend reversals.
It has been noticed that before a trend reverses, there is often a sharp change in price dynamics. This impulse allows understanding that the old trend is over and the new trend begins.
Quick link to content
- Stochastic indicator formula
- How does the stochastic indicator work?
- Stochastic oscillator example
- Stochastic oscillator basic signal
- How to use the stochastic oscillator?
- Summary
Stochastic indicator formula
For each price value you can calculate Stochastic indicator values using the formula:
%K = 100(C – L14) / (H14 – L14)
Where:
%K – Stochastic line
C – closing price of the instrument
L14 – the lowest price of the last 14 periods
H14 – the highest price of the last 14 periods
How does the stochastic indicator work?
The basic principle of the Stochastic indicator is that it compares the instrument close price with the difference between the high low range prices for a certain previous period. The standard setting is 14 candles of the current time period.
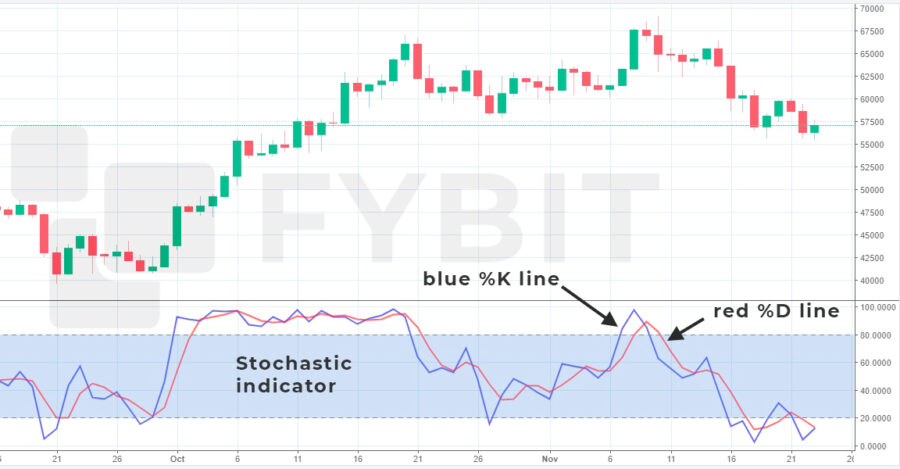
The Stochastic oscillator is displayed in a separate window under the chart with a range of values from 0 to 100. Two colored lines are used: blue %K and red %D.
%K – indicates as a percentage the ratio of the closing price of the current candle to the difference between the instrument’s high low range values during a given period, usually in blue
%D – calculates the average value of %K for the specified number of periods (for the last 3 candles as usual), also called “moving average of K” and is usually red.
It is easy to see in technical analysis that both lines of the Stochastic indicator will be near the top of the range for an uptrend and vice versa for a downtrend. The range from 80 to 100 is called an overbought level, and from 0 to 20 – oversold. When the line %K starts to change its direction and move away from the highs or lows after a long period of being in these overbought and oversold levels, you can interpret this as a slowing down of the momentum and a potential change in the trend reversals.
Stochastic indicator is most accurate in case of smooth, slow moving trends and in the presence of broad trading ranges. If %K rebounds from the highs, declines to 80, and then crosses 50 downward, it is a clear signal that the uptrend is changing into a downtrend. And vice versa, crossing the value of 20 from the bottom to the top and then crossing above 50 from the top downward indicates that an uptrend has begun.
Another important technical analysis pattern of weakening of the current trend and future reversal is divergence. It looks like contrary trends in the price of an asset and Stochastic indicators lines.
Stochastic oscillator example
We will now look at an example of overbought and oversold readings by comparing the closing price of a candle to the difference between the maximum and minimum prices of the asset over a certain period of time.
There is a pattern that the closer the close price is to the recent maximum prices, the more likely it is that we are in an uptrend phase. And vice versa, the closer the close price is to the recent minimum prices indicating a downtrend.
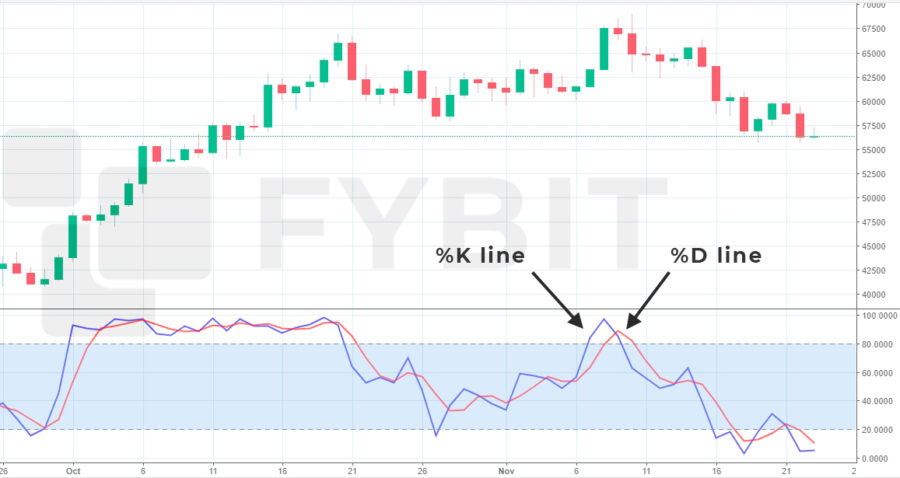
The indicator displays both lines in a separate window at the bottom of the graph in the range from 0 to 100. As usual, the dotted lines indicate the key levels of 20 and 80. Crossing of these lines or mutual %K and %D lines crossing below 20 or above 80 is considered especially important. It can often be regarded as a signal for a specific trading decision.
Stochastic oscillator forms quite accurate and correct technical analysis signals in moderately fast market action movements but requires confirmation by other tools, such as Stochastic RSI or Momentum indicator.
Stochastic oscillator basic signal
Signals from stochastic oscillator lines cross are close relative in their logic to crossing moving averages:
- If the blue %K line crosses the red line %D from the bottom up, we can talk about the potential formation of a buy signal for the asset. And if this crossing occurred below the 20 level, it further strengthens the signal.
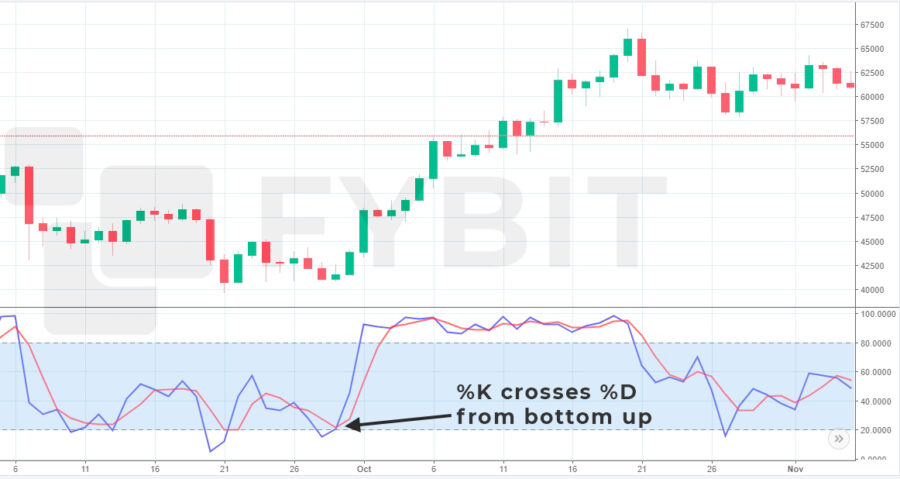
An example of BTCUSD %K line crosses %D line from bottom to top - If the blue %K line crosses the red line %D upwards downwards, we can talk about a potential formation of a sell signal for the asset. And if, in turn, the crossing occurred above the level of 80, this further strengthens the signal.
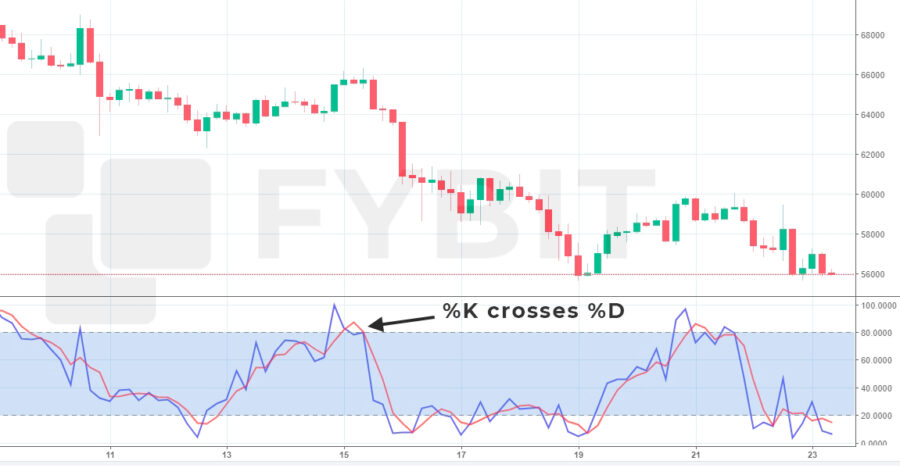
An example of BTCUSD %K line crosses %D line from top to bottom - When the stochastics %K line rises above the 80 level, we can consider that the asset enters an overbought level. So it is likely a change from a bullish to a bearish trend.
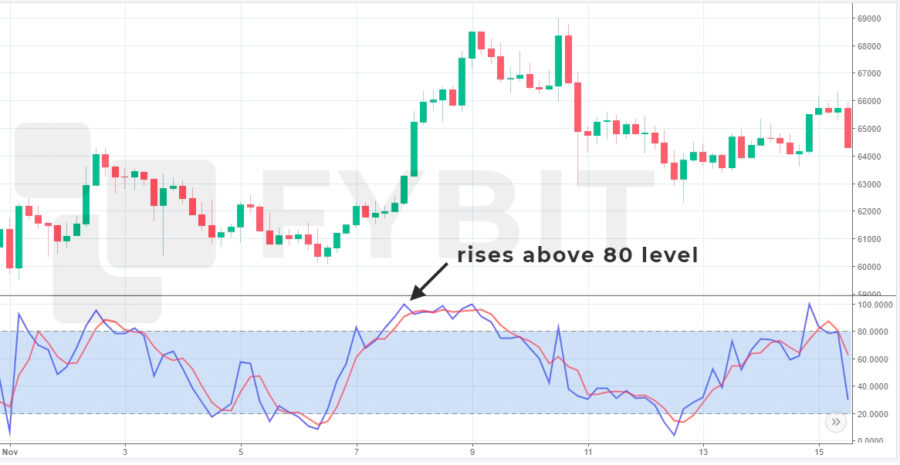
Example of BTCUSD stochastic rises above 80 level - Conversely, when it falls below 20, the instrument enters an oversold phase and a bullish reverse trend signal is expected. However, it is important to keep in mind that this logic works well for trading within a certain channel. But if the established trend is strong, the price of the asset may remain overbought or oversold for a long time.
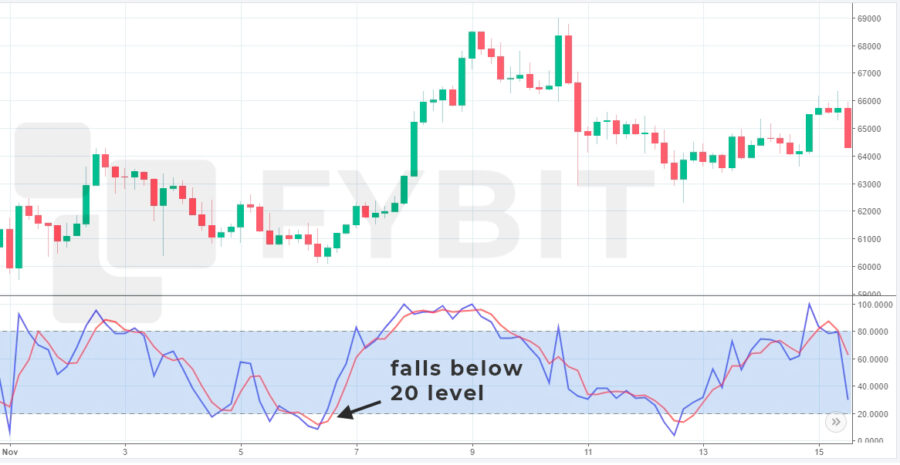
Example of BTCUSD stochastic falls below 20 level
How to use the stochastic oscillator?
There are four main strategies for using the stochastic oscillator in your trading, and now we will take a look at each of them.
1. A strategy of exiting overbought/oversold levels.
This is one of the most basic strategies when we use only the Stochastic itself to make a trading decision.
After the stochastic %K line has been below 20 for some time, and then rises sharply enough above 20 – a buy trade can be opened.
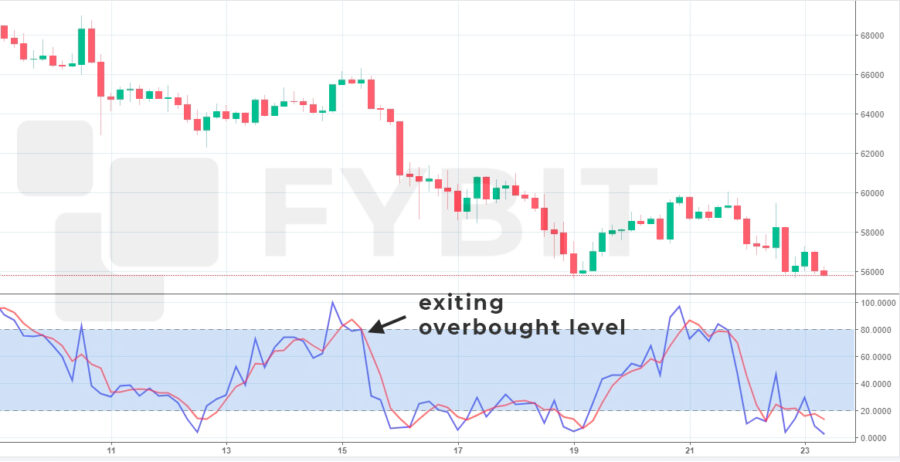
In the opposite situation, when the %K is above 80 and falling fast enough, it’s a signal to open a sell trade.
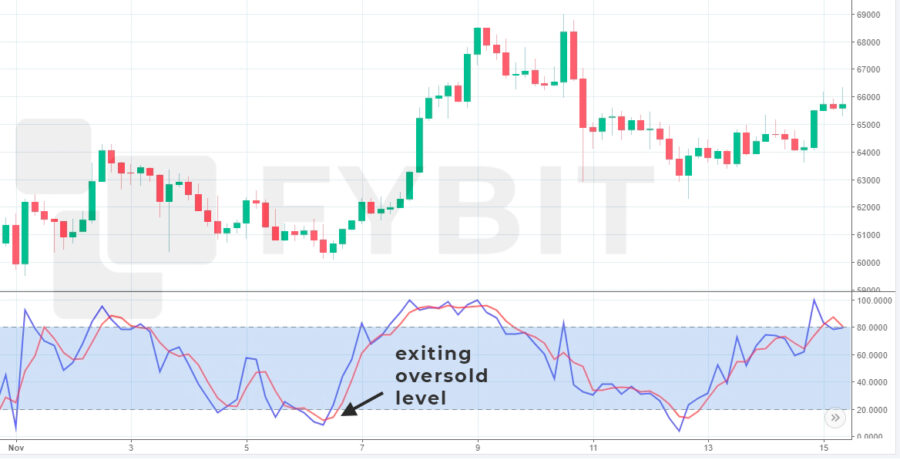
exiting oversold level
When using this strategy, it is very important to understand that the exit from the overbought or oversold levels does not guarantee that the price will continue to follow a new direction. These levels simply indicate the upper and lower limits of the ranges in which the asset was previously traded. However, there is a certain probability that the relevance of these ranges will remain now.
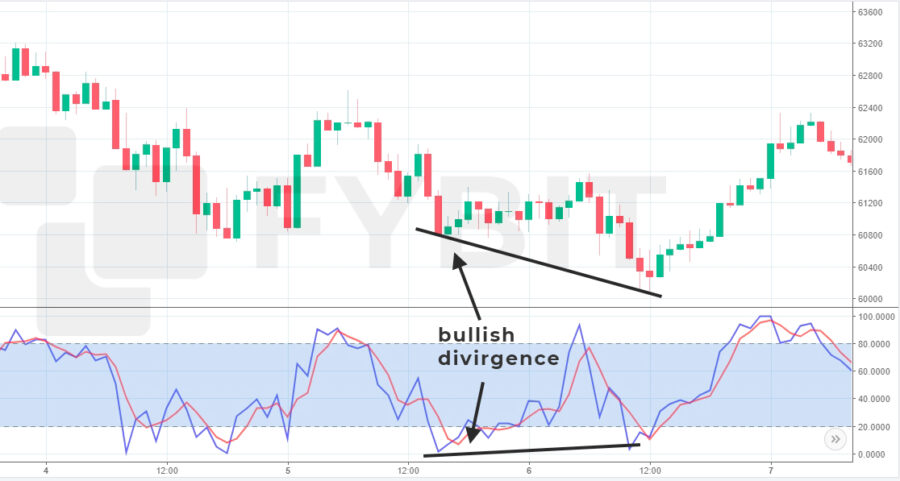
2. Bullish and bearish divergences strategy
The second most popular trading strategy is Stochastic divergence. The principle is to find a pattern when the instrument price successively updates several higher highs, while the stochastic indicator, on the contrary, updates a lower high at the same time. Such reciprocal behavior of the price and the indicator may be a signal of a trend reversal.
We should also keep in mind that the divergence itself is not a 100% signal for making a trading decision. It also requires confirmation by other indicators or patterns as the instrument price formations because the divergence may continue one direction movement for quite a long time before it reverses.
So, there can be two types of divergence:
- Bullish divergence forms when selling pressure decreases. During this, the instrument price updating lower low and the Stochastic oscillator updating higher low. An upside reversal is possible.
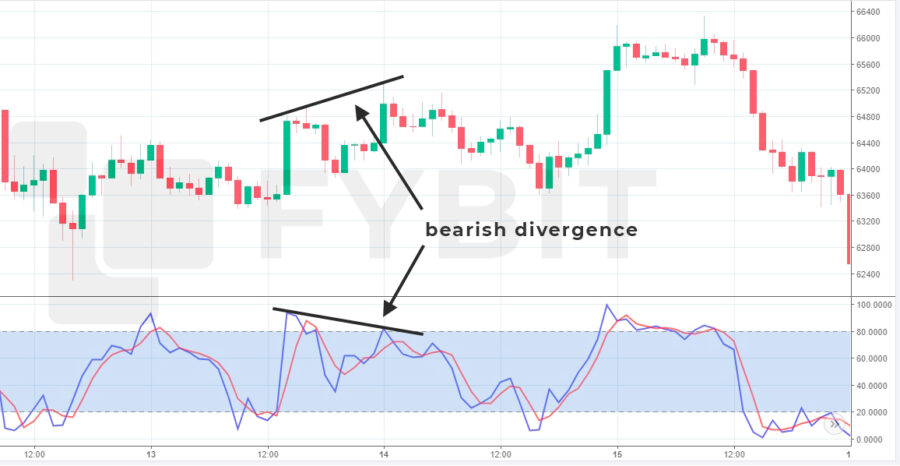
- Bearish divergence forms at the moment when there is a weakening of the growth momentum. The instrument price is consistently updating higher high and the Stochastic oscillator is the lowest high.
3. Crossing lines of Stochastic Indicator
An equally popular strategy is trading in the overbought/oversold area when Stochastics cross stochastic lines. It works best when the price range of an instrument is traded in a certain channel, even in broad trading ranges. In this case, there are two types of signals:
- upward momentum: if in the oversold area of the Stochastic oscillator the %K line crosses the line %D from the bottom upwards
- bearish reversal: if in the overbought area of Stochastic oscillator the %K line decreases and then the %K line crosses the %D line from top to bottom
If the market is in a strong trend movement, we can use the absence of new crossings of lines %K and %D in the overbought or oversold region to confirm that the trend is still in force.
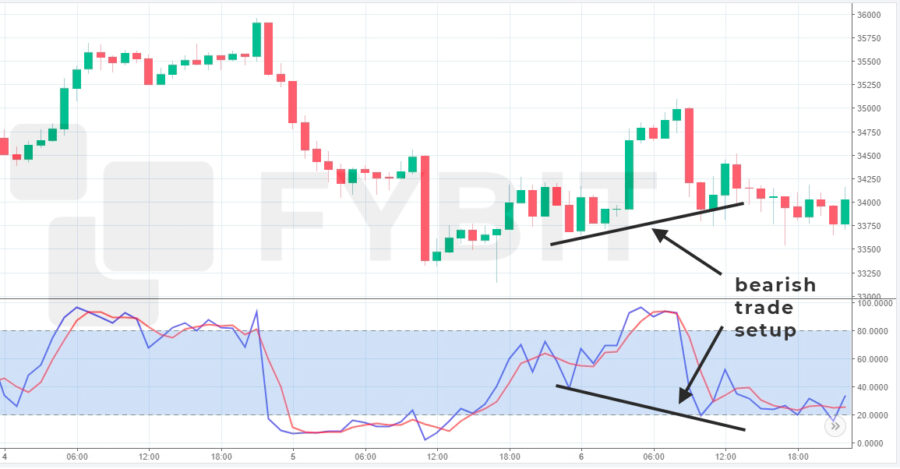
4. Bullish reversal/bearish reversal strategy of Stochastic Indicator
In addition to the strategies listed above, you can use the Stochastic oscillator for another strategy – identifying bullish and bearish trading setups:
- The price of an instrument is likely to go higher when the Stochastic reaches a higher high and the price of an instrument reaches a lower high from a sequence of tops;

- The instrument price can go lower when the stochastic indicator updates a lowest low and the asset price has reached a higher low at the same time.
In both cases, the trader’s task is to enter the main price movements after a small pullback. But it is also important to understand that the built-in sensitivity of the Stochastic oscillator often leads to false signals. This is normal behavior for this indicator and you should always take this point into account in your trading.
Summary of Stochastic Indicator
To summarize, I would like to say that the Stochastic oscillator is a very versatile and useful indicator. You should use it primarily to determine the reversal of the trend, overbought or oversold levels, and find the support and resistance lines when the instrument price trades in a range. The main thing to do to get accurate Stochastic oscillator signals is to choose a more appropriate strategy in a certain situation and get confirmation from other indicators or patterns that you use in trading. All of this will make you able to train on past performance and improve the future results at the financial markets.