There are hundreds of indicators in the TradingView account by default, but most traders always pick out certain favorites and mention only them.
Despite the fact that a huge amount of indicators are constantly in front of us, these tools do not seem useful for most traders.
Just google for best oscillators and you will see the top searching queries that consist of the Relative Strength Index or Stochastics, Commodity Channel Index, and so on. Most popular trading signals are based on these tools and we all know their advantages. But what do we know about hundreds of other indicators and their advantages?
We follow traders’ expectations, so in this article, we are going to discuss the unfairly forgotten Relative Vigor Index or RVI. This indicator could become your most important tool in the future. So let’s check it out.
Article contents:
- Relative Vigor Index indicator
- Formula
- Setting of RVI
- How to use Relative Vigor Index?
- Trading strategies with other indicators
- How to access RVI on FYBIT?
- Conclusion
Relative Vigor Index indicator
The Relative Vigor Index is called RVGI or RVI (not the same as Relative Volatility Index). It’s a momentum indicator used in technical analysis. This technical indicator is categorized as an oscillator in most trading platforms.
It compares an asset’s closing price to its trading range and smoothing the results by using simple moving averages (SMA).
The idea of RVI indicator is to gauge the strength with which the market moves from one direction to another. Externally, it resembles the stochastic and is also an oscillator with two lines – the mainline and the signal line.
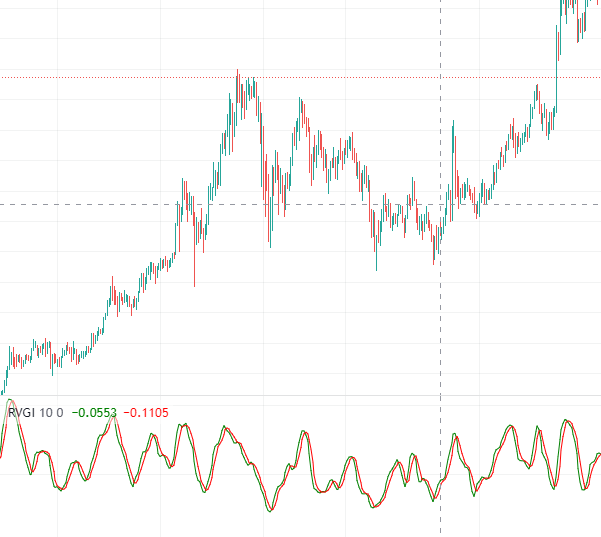
TradingView displays RVI indicator as the combination of two lines – red line & green line. The green one is the RVI line, while the red one is the signal line. Some of the traders used to add the zero line. We have added RVI indicator to BTC/USD price chart below.
RVI indicator is based on a simple concept of comparing lows and highs, which makes it one of the most flexible oscillators that represent a trend and its changes.
Formula
The concept of the Relative Vigor Index formula is quite simple. During an uptrend, closing prices are higher than opening prices, and vice versa: during a downtrend, closing prices are lower than opening prices. So the strength of the movement is estimated by the size of the price change in a given period.
The RVI indicator is calculated in several steps. First, you need to calculate the difference between the closing price and the opening price of the period and divide the resulting indicator by the difference between the maximum and minimum of the period. If the candle was falling, the quotient of the division will have negative values, if it was rising, it will be positive.
In addition, the value of the quotient takes relative values and indicates what proportion of the total range of the candle is the range from the opening to the closing (the maximum values are -1 and 1 if the candle opened at one extreme and closed at the opposite).
RVI = (Close – Open)/(High – Low);
The second step is smoothing the RVI value using moving averages. This will give us the RVI line. The default color in TradingView is a green line.
The third step is to get the signal line, the slow red line. The signal line equation smoothes the RVI line using a weighted moving average over four periods.
So the RVI indicator shows the consistency of the short-term and long-term consensus of what do traders expect regarding the current trend.
Setting of RVI
There are not many settings for the RVI indicator. The default period for most platforms and also for TradingView is 10. You can change the period which fits your trading strategy.
How to use Relative Vigor Index?
The signals of the Relative Vigor Indicator are similar to principles used in the stochastic oscillator, with the exception that overbought/ oversold zones are split by zero-line. The higher values of the indicator, the more the price tends to increase. The lower values, the more it tends to decline.
In order to determine entry points, we are going to discuss the most popular and effective methods, such as the crossovers of the RVI line with the signal line, the RVI divergence or overbought/ oversold zones.
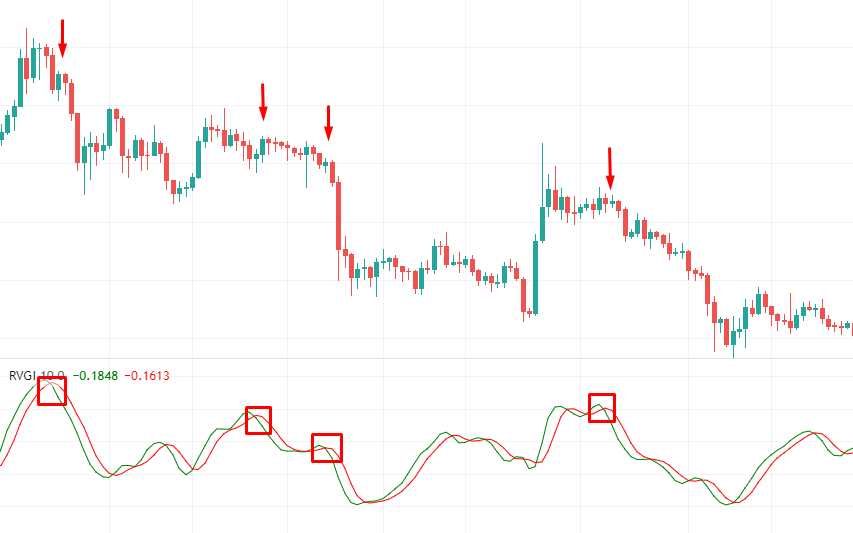
Bearish RVI Crossovers
The RVI crossover is not much different from lines cross between two moving averages. These crossovers are designed to be leading indicators of future price direction.
First, we check the trend. Then we wait for the price to complete an upward correction. The sell signal occurs when a fast green line crosses the red one from above. The higher the crossover, the stronger overbought conditions, and subsequent price movement downside.
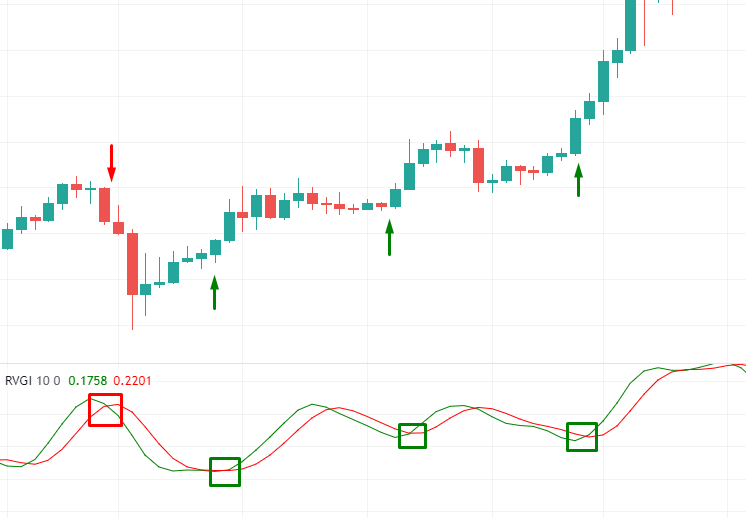
Bullish RVI crossovers
The same concept works for opposite movements.
Check if it’s a bullish trend. Buy signal for us will be the moment when a fast green line crosses the red one from below. If the two lines made the crossover below the zero-line, sentiments of the market tend to open a long position.
Note: Beginners often don’t pay attention to the trend. As the result, they start losing money rapidly.
RVI divergence
If you have heard of the Relative Strength Index indicator, probably you know how to use Divergences.
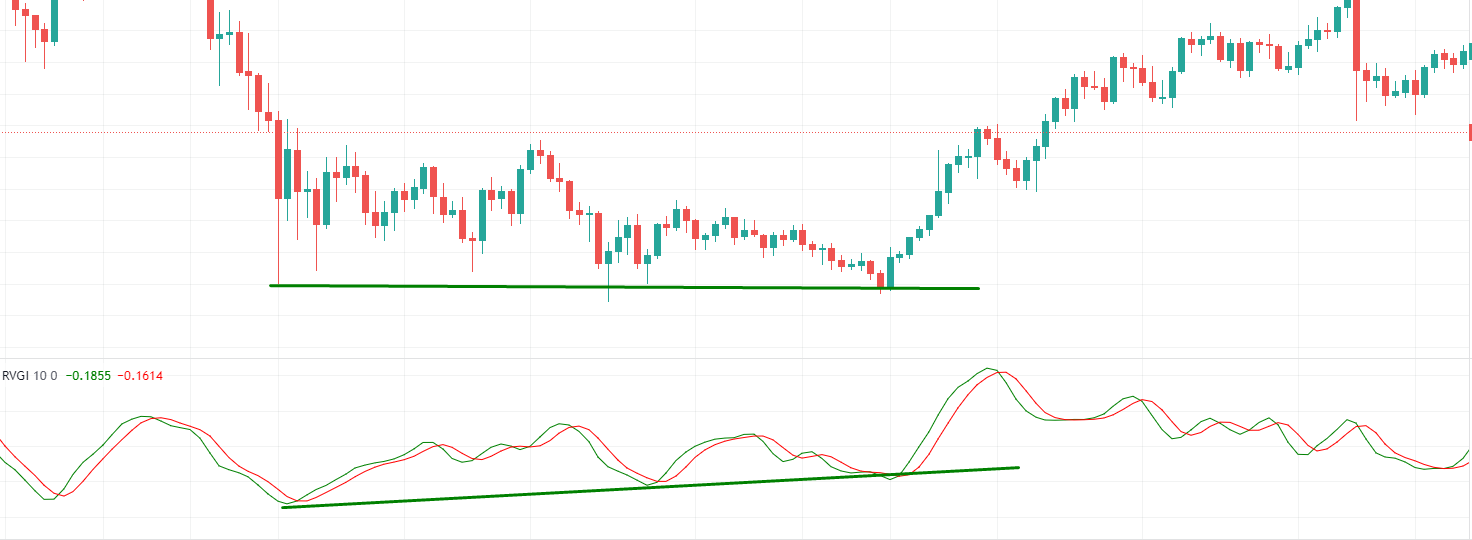
A bullish divergence occurs when the actual price reaches new lows, while the lows of the Relative Vigor Index are higher than the previous ones.
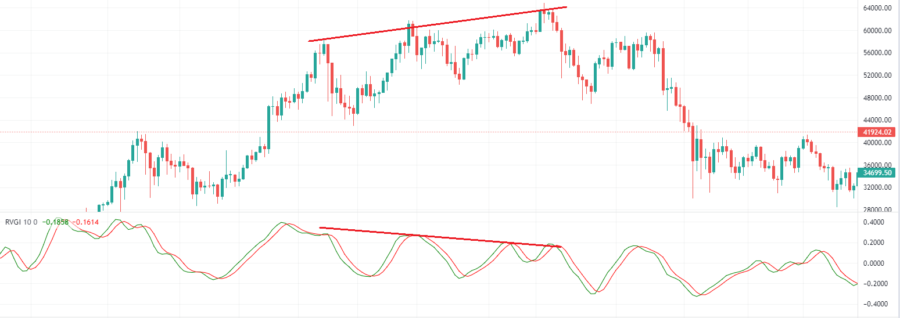
A bearish divergence happens when the actual price reaches new highs, while the highs of the Relative Vigor Index are lower than the previous ones.
Overbought and Oversold zones
As we mentioned before relative vigor index has its own overbought/ oversold zones. Unlike the majority of oscillators and other indicators, RVI zones are considered as values above or below the zero line.
The main point is if RVI waves are above zero line – it’s a bullish indicator, it shows that the market is full of demand. If you use big time-frames – it’s a great signal that bulls are ready for a long-term uptrend.
The RVI below the zero line is a bearish indicator. It reveals oversold conditions of the market.
Trading strategies with other indicators
The RVI indicator is a completely independent analytical tool, but it has enough drawbacks. The main problem, of course, is that it often gives false signals. You can reduce the percentage of such unjustified messages by using additional trending markets indicators.
RVI + MACD
Moving Average Convergence Divergence and RVI look alike and using these tools can help you to remove false signals of each indicator in your trading strategy. Standalone crossover of two moving averages shows where the trend starts end ends. Adding RVI to MACD gives you another additional confirming signal, more mobility in exiting positions, and a more detailed comprehension of the market state.
These are two simple rules for long/short trades.
- Open position after crossover confirmation of two indicators
- Close position with RVI crossover
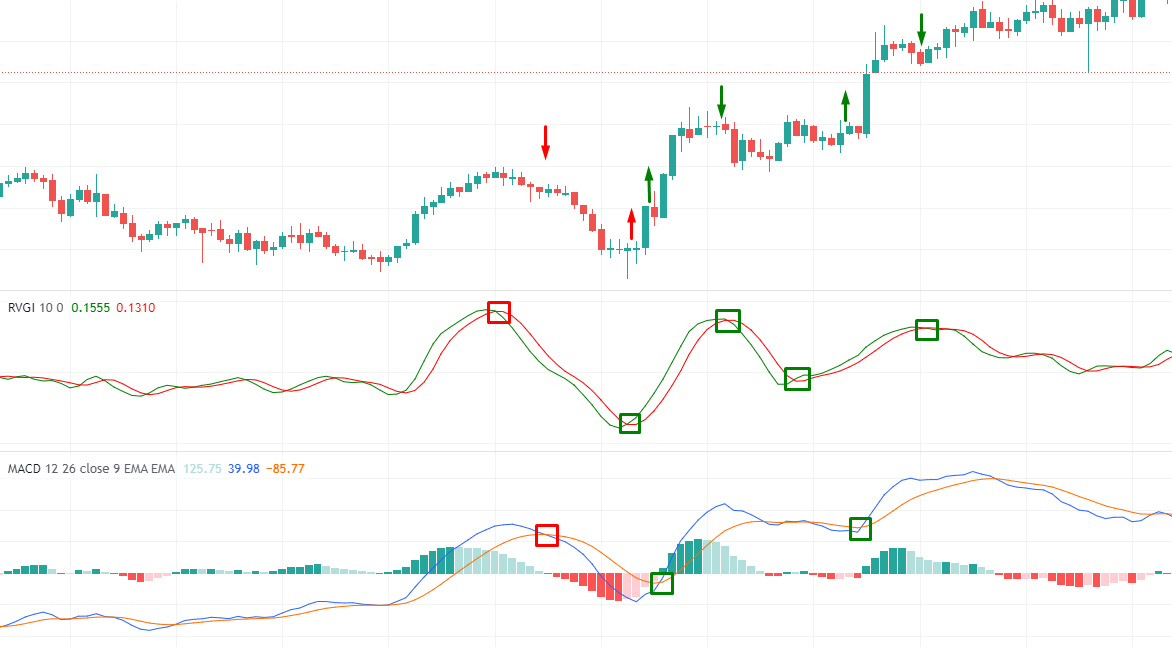
We are going to observe 1H bitcoin to USD chart in picture #5. The first example is a short trade. We open the trade after the second confirmation with a stop in few pips above. As you can see, prices end right where the RVI crossover occurs. This is our signal of the end of past performance.
The next examples describe the same algorithm for buy positions. After the previous example price makes the reversal. After the second crossover positive setting of bulls gives us the chance to open a long position. Right after reaching new price highs, we see RVI crossover – the signal to close the existing buy position.
This strategy uses double confirmation to opening your trade and reveals the best exit points. It shows the highest probability outcomes in the overall uptrend.
The disadvantage of this strategy is trading in flat zones. In flat zones, the signals from the indicators are not so clear and should be filtered. It is good to make such trades if you can outline the approximate limits of the range in which prices are moving.
RVI divergence + Bollinger Bands
This strategy shows high efficiency with small timeframes – hour or minute. The best period is 1H.
As you know, Bollinger Bands consists of two bands – upper & lower – and a simple moving average (20 periods SMA). In this trading strategy, traders should use the SMA crossover signal as an entry point.
These are two simple rules for long/short trades.
- Open a position after the crossover of SMA in the Bollinger Bands and the crossover of the RVI.
- Close the position using RVI divergence
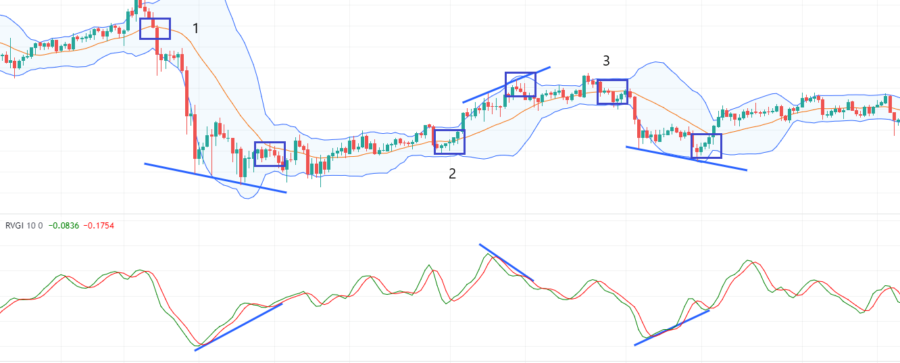
Bollinger bands are closely related to MA as a trend instrument. Therefore we recommend using SMA crossover to determine trend direction. In the first and third examples, a trader opens and holds a short position after the RVI and SMA crossover. The trader closes his short trade with the RVI divergence.
How to access RVI on FYBIT?
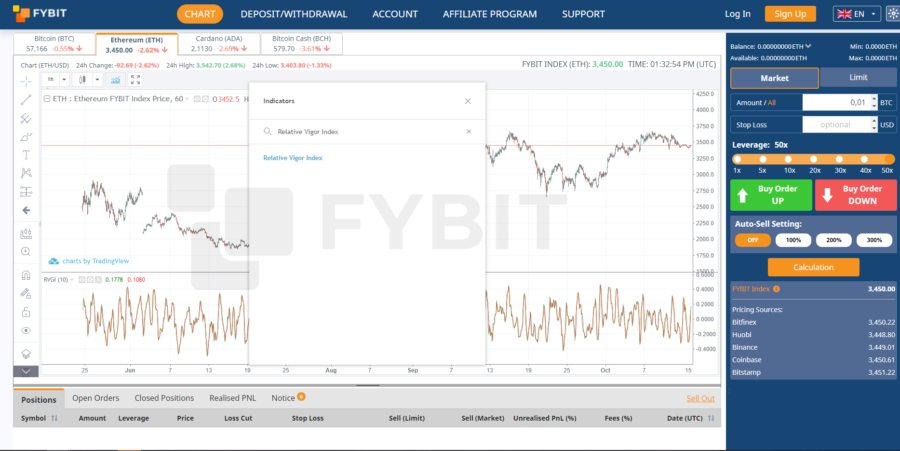
In order to access the Relative Vigor Index (RVI) go to our main page and open the chart.
Click the “Indicators” tab and enter “RVI” or “Relative Vigor Index”.
Most trading platforms usually have the same issues – lagging platforms or bots in the support team.
FYBIT is the platform where you will forget about these issues and will be satisfied by trading itself.
We recommend you our trading platform and hope you will enjoy it.
Conclusion
The Relative Vigor Index is an excellent leading momentum indicator. The combination of two lines provides readable predictions of the state of momentum.
A trader should understand the basics of indicators he uses, their advantages and disadvantages. And based on this data build high risk or low-risk trading strategy.
We have described the basics of RVI and various combinations with complex instruments and explained the advantages and disadvantages of each combination.
We hope this tool will help you maximize profits. Check Relative Vigor Index and do not trade with half profits, good luck.