Momentum indicator is a fairly popular technical analysis indicator, which has gained the trust of traders and technical analysts due to its simplicity and versatility. It can be used on any markets and timeframes. Momentum indicator compares the current closing price of the instrument with the previous price movements for a certain past period.
There are several types of momentum indicators, but in this article, we will consider the most popular of them – Momentum Oscillator. Next, we will look at how it is calculated and what trading signals it generates.
Quick link to content:
- Momentum indicator formula for closing price N periods ago
- How Momentum indicator works?
- Examples of Momentum indicator trade signals
- Other popular Momentum indicators
- Summary
Momentum Indicator formula for closing price N periods ago:
There are several types of Momentum indicators, most of them are calculated using the formula:
Momentum indicator = ( Close(i) / Close(i – n) ) * 100, where:
Close(i) – actual or most recent closing price of the current candle for this timeframe
Close(i – N) – closing price of the candlestick N bars ago.
As usual, N = 10 and it’s called the period of Momentum indicator.
Thus, we get a coefficient that deviates from 100 up or down. A momentum line value greater than 100 in most cases means that the current price of the instrument is in an uptrend. Conversely, if the momentum drops below 100, it is appropriate to talk about a downtrend. What’s also important to note is that the greater this numerical deviation is far from zero line in one direction or another, the stronger the instrument price impulse is.
How Momentum indicator works?
The indicator can generate the following signals:
- Continuation of the current trend – if Momentum updates the highest or lowest price values relative to the previous historical values.
- A trend reversal when it exits overbought or oversold levels – after the oscillator has been near recent highs (which could mean overbought) or lows (which, in turn, could mean oversold).
Important note: it is recommended to use additional indicators or analysis of price changes behavior in addition to the Momentum, since the indicator value may stay in overbought or oversold levels for a long time. This is because these levels, like the oscillator itself, have no fixed boundaries.
- Trend reversal when a divergence is formed. A bullish divergence occurs when sellers’ pressure decreases. You can see it on the chart when the instrument market price line is making consecutive descending lows, and the indicator is making ascending lows. At the same time, the bearish divergence clearly indicates that the growth impulse is weakening. The price chart simultaneously updates new price highs with successive declines of the oscillator at several peaks.
Of all the signals above, divergence is the most difficult to master for beginners (compared to overbought or oversold). First of all, because this signal is less frequently formed at all markets and timeframes. But at the same time, bullish and bearish divergences are more reliable signals requiring less confirmation from other indicators or price action patterns. And they are also signals that could potentially turn out to have a better profit-to-risk ratio. This is because divergence is quite often a harbinger of a global current trend reversal. Past performance analysis helps to find these patterns.
Examples of Momentum Indicator trade signals
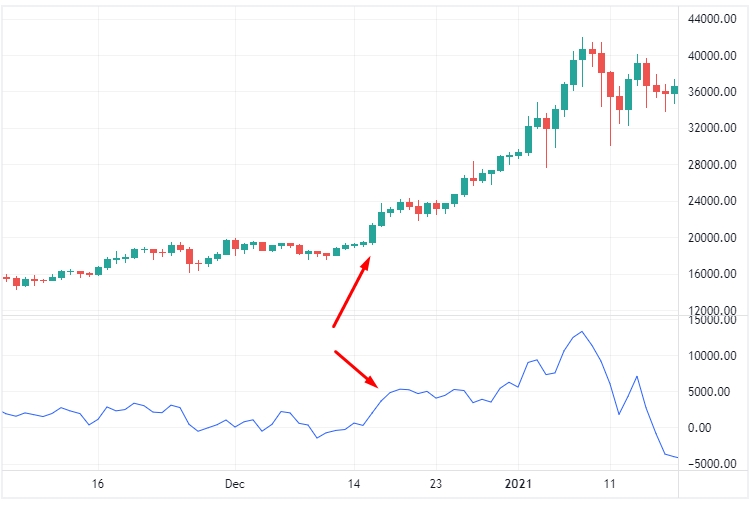
On the chart, we can see how Momentum line clearly indicates the continuation of the uptrend for BTCUSD on the H4 timeframe:
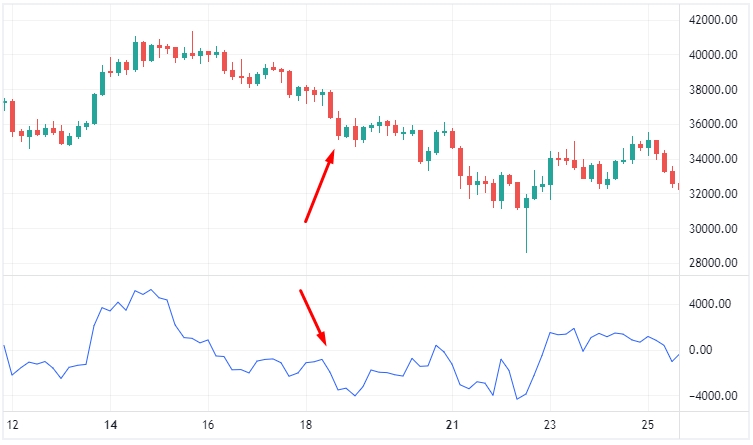
And in this example of sell signals, on the contrary, the bears seized the advantage and did not slow down the pace of their onslaught:
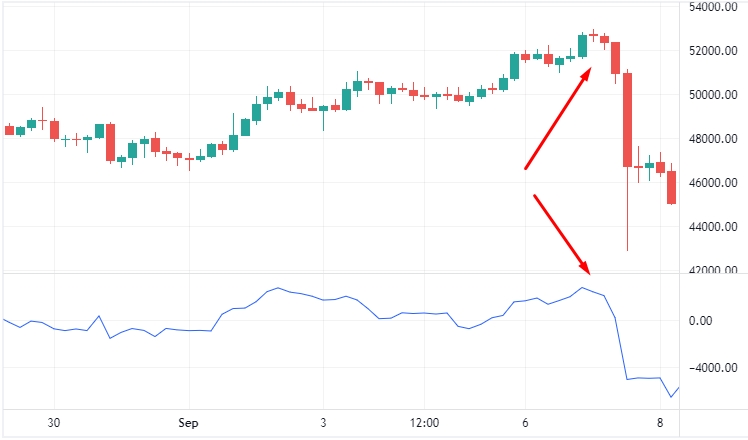
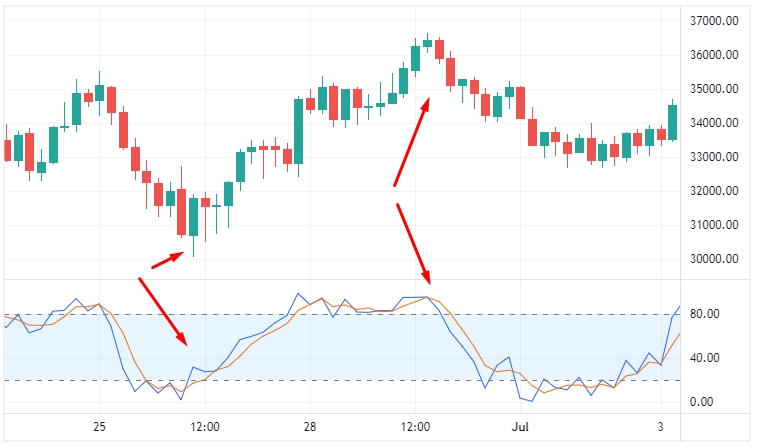
A good example of sell signal of momentum oscillator overbought and downward movement: the BTCUSD price movements reversal signal is confirmed by the formation of a Doji candlestick pattern. It is always a strong signal when the other technical analysis tools show that market price has been in uptrend momentum and now it is going to fall slow or fast.
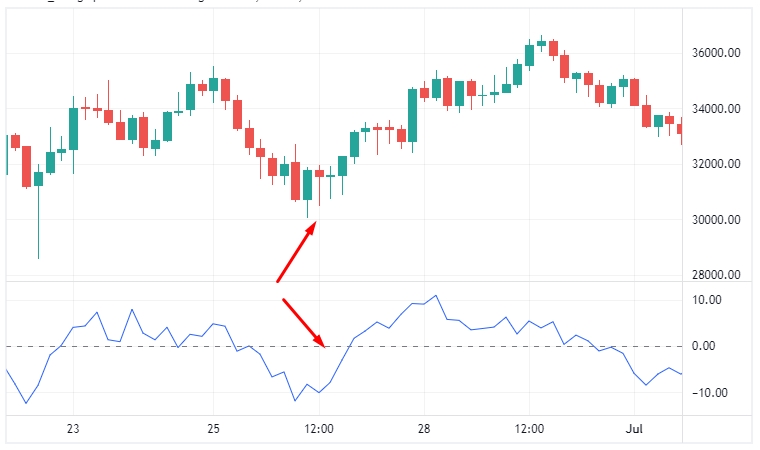
A similar confirmation for a mirror buy signal formed due to a rebound from the momentum oscillator oversold area:
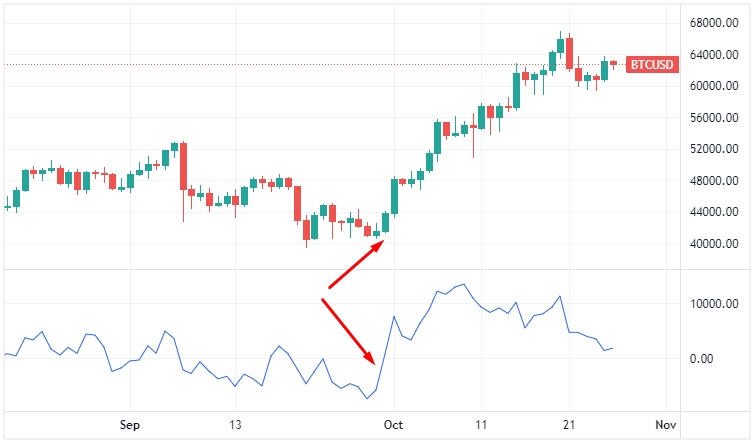
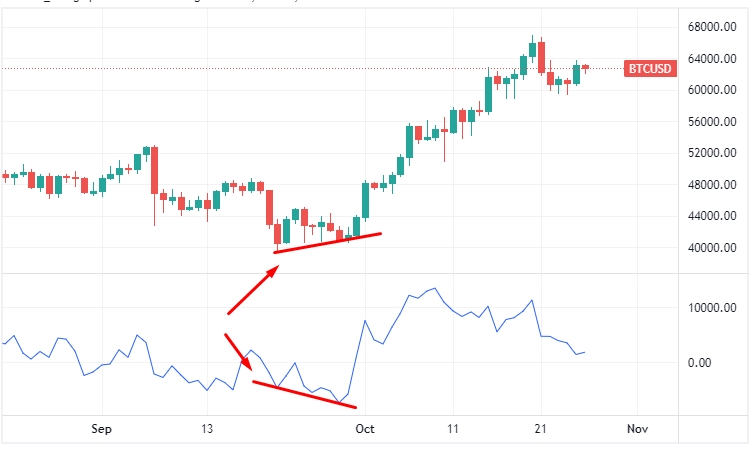
And on this price chart, we can see a not so obvious, but later confirmed bullish divergence. It was formed consecutively by two lows of indicators momentum:
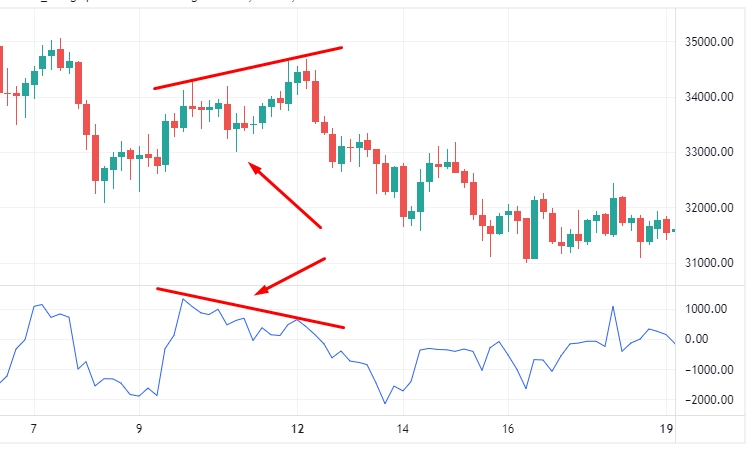
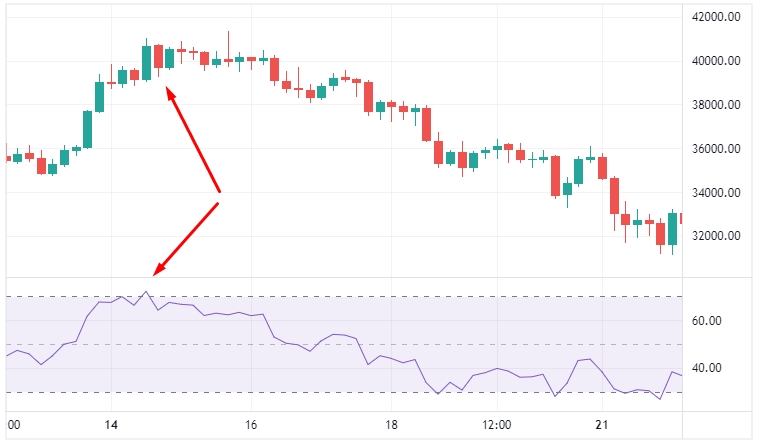
And the final example is a very bright momentum oscillator bearish divergence on the BTCUSD chart with the H4 timeframe:
Other popular Momentum Indicators
As mentioned earlier, the Momentum oscillator is not the only indicator of its kind. The following technical indicators are also popular among traders:
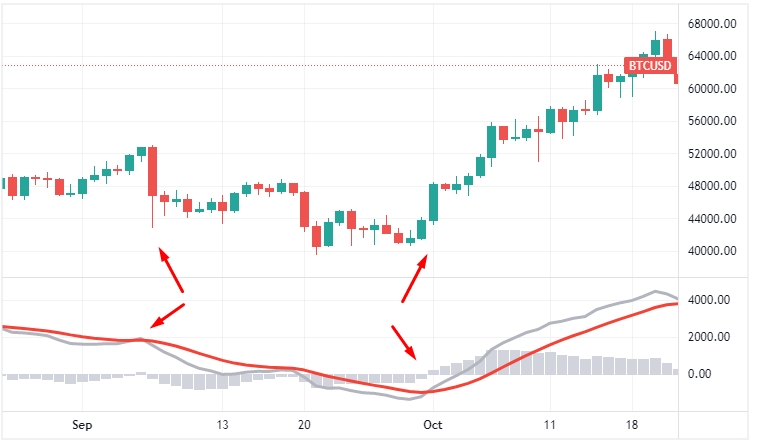
Moving Average Convergence Divergence (MACD)
MACD shows momentum by using 2 moving averages of financial instrument. 26-period EMA is used for red MACD signal line. And the gray MACD line is presented by 12-period EMA . MACD is used to find trade signals of uptrend or downtrend momentum price movement.
Rate of Change (ROC)
ROC is very similar to Momentum Oscillator, the main difference is in the calculation formula:
ROC = ( Close(i) – Close(i – n)/ Close(i – n) ) * 100, where:
Close(i) – current closing price of the candle for this time frame
Close(i – N) – closing price of the candlestick N periods ago.
All the signal patterns are the same as for the Momentum Oscillator for overbought or oversold conditions, also as momentum diverge
Stochastic Oscillator
The Stochastic Oscillator has two lines, called %K and %D signal line. It has a range from 0 to 100 with overbought 80 level and oversold 20 level. Crossing stochastic lines higher or lower these levels is the most popular trading signal of this indicator.
Relative Strength Index (RSI)
RSI is a market momentum directional indicator that shows the ratio of the average price increase to the average price decrease over the period. It is effective in indicating overbought and oversold levels.
Summary
Momentum indicators are fairly simple yet reliable tool of technical analysis. If you study it and begin to apply it in your trading, you will definitely become better at understanding the current market situation and improve your trading systems.