 predict the trend direction change 2) confirm the strength of current trend)
The Vortex indicator is a relatively new indicator that was developed by Etienne Botes and Douglas Siepman in 2010. They drew inspiration from the basic ideas from one of the most famous technical analysis traders Alexander Elder. This indicator is used by traders for technical analysis along with other popular tools. Its two main tasks are to predict the trend direction change of the instrument and confirm current trends. The vortex indicator is universal and can be used on any time frame at all financial markets and most platforms – currency, commodities, stocks, and cryptocurrencies.
Quick link to content:
- How Vortex Indicator works?
- 5 steps to calculate Vortex Indicator
- How to interpret the Vortex Indicator correctly?
- Examples of Vortex Indicator
- Summary
How Vortex Indicator works?
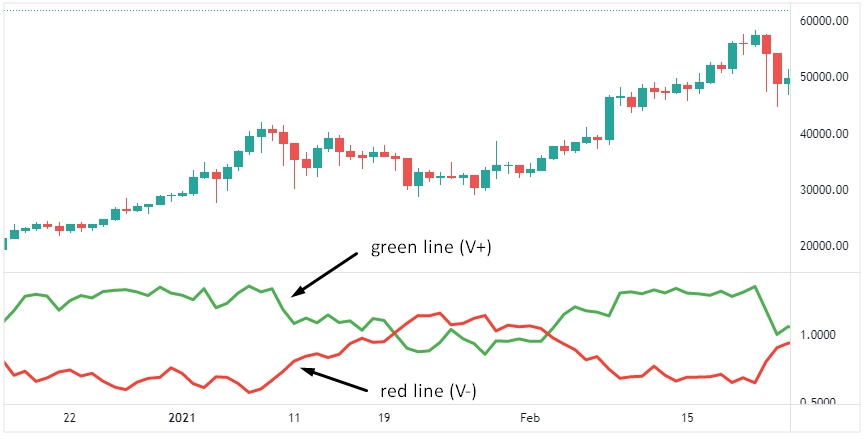
The Vortex indicator is typically graphed independently as the green and red lines in a separate window below the chart. The green line shows the potential for an uptrend and the red line shows the potential for a downtrend. Considering the mutual position of these two lines, it is possible to make an assumption about the further price movement, getting buy and sell signals. As a rule, if the green line (VI+) is above the red line (VI-), we can conclude about the positive trend movement. And, on the contrary, the position of the red line (VI-) above the green line (VI+) indicates a downward trend.
The main principle of the Vortex indicator is that it compares the highs of the previous price bar with the low of the current one. The indicator works at all timeframes, financial markets and instruments – stocks, currencies, commodities and cryptocurrencies. The greater the distance between two lines of the indicator, the more powerful the current price movement is. Conversely, the closer the green and red lines are to each other, the weaker the existing trend direction, or the price currently is in a sideways movement. The main signals of the Vortex indicator are built on the sharp change in the distance between the two lines of the indicator.
At the moment when the green line of the positive vortex crosses the red line of the negative vortex from the bottom up, we can talk about a potential signal for an upward reversal. And the longer VI+ stays above VI-, the stronger the confirmation of this signal. And conversely, a bearish signal (or bearish crossover) is formed when VI- crosses VI+ upwards.
5 steps to calculate Vortex Indicator
The complete calculation of the Vortex indicator consists of five steps:
1. First, you need to calculate the positive and negative price movement:
A positive price movement (VM+) is calculated as the maximum of the current candle minus the minimum of the previous price bar.
In turn, to get a Negative price movement (VM-), you need to subtract the maximum of the previous candle from the minimum of the current candle.
-
Calculation of index values for all periods:
The standard setting is the Vortex indicator with the number of periods equal to 50. In this case, you need to get their sums:
VM50+ is considered as a total sum for each VM+ from the period 50 previous market’s price bars
VM50- is similarly, the sum of all VM- for the period 50 price bars
-
Calculate the True Range (TR):
Next, you need to calculate the True Range, which is the largest absolute value of these three:
- The difference between the current low and the current high
- The difference between the current low and the previous close
- The current maximum minus the closing price of the previous bar
-
Repeat this operation for the entire period of the indicator:
For standard settings of 50 periods: TR50 = sum of each of the 50 periods True Range
-
Calculate VI+ and VI-
At the last, calculate the final value of the green and red lines of the indicator:
VI50+ = VM50+ / TR50
VI50- = VM50- / TR50
For convenience, let us again list all the notations:
VI50+: the value of the green line of the Vortex indicator with a period of 50
VI50-: value of the red line of the Vortex indicator with a period of 50
VM50+: positive price movement of the last 50 periods
VM50-: negative price movement for the last 50 periods
TR50: True Range Over the last 50 periods
How to interpret the Vortex Indicator correctly?
It is better to use the optimal number of periods for each trading style. This means that it is better to use fewer periods for short-term trading – this way the technical indicator will be more sensitive to market changes. And in order not to miss a long trend movement in long-term trading, a longer period is used.
The most important trading signal, which is formed by the Vortex indicator:
- Bullish signal – when the positive line VI+ crosses the negative MSH- with upward movement
- Bearish signal – on the contrary, when the negative red VI- from the bottom up crosses a positive VI+
It is important to keep in mind that signals from the Vortex indicator require confirmation from other instruments, such as candlestick patterns, price action, moving averages, or one of a series of momentum technical indicators. Having received such confirmation to avoid false signals, it is much more probable to make a profitable deal. The Vortex indicator itself can give too frequent and false signals (if you use it with a small period for short-term transactions). Or the signal can be accurate enough, but with a small margin of profitable price movement (if you use large periods in setting up the indicator).
Examples of Vortex Indicator
- Example of BTCUSD bullish signal continuation of the positive trend movement:
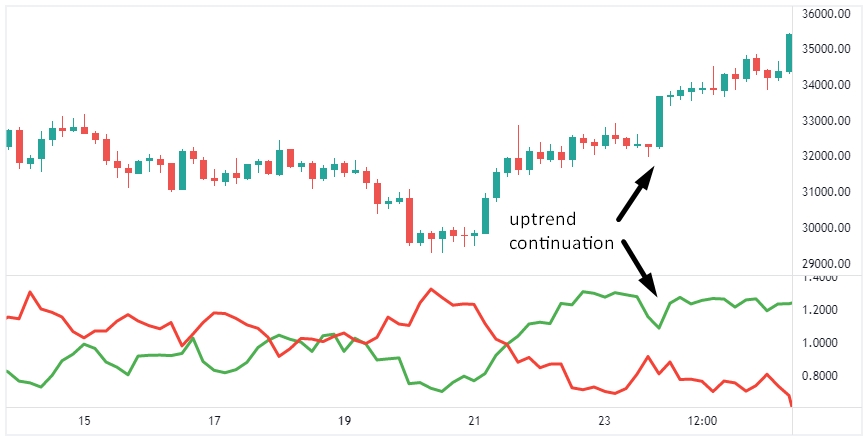
Example of BTCUSD uptrend continuation - The typical pattern of BTCUSD continuation of the negative trend movement:
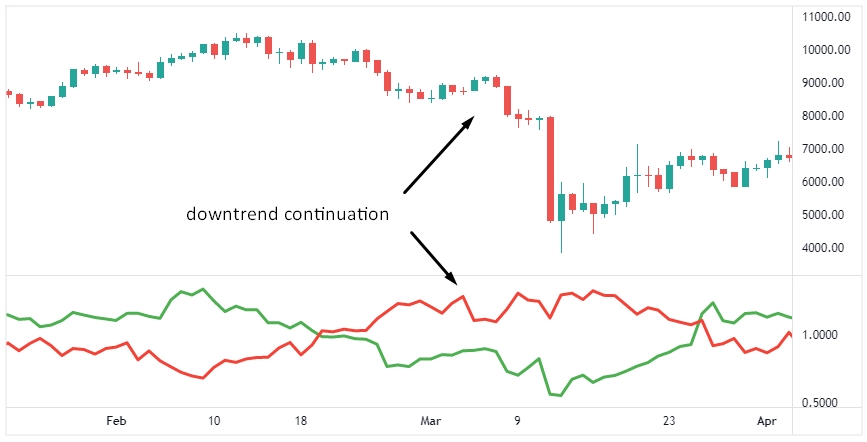
The typical pattern of BTCUSD downtrend continuation - And now let’s look at an example of BTCUSD bullish reversal buy signal at H4 timeframe:
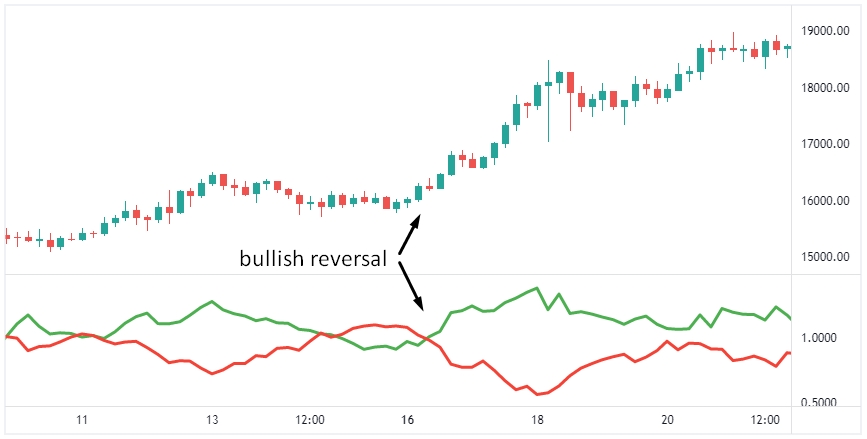
Illustration of BTCUSD bullish reversal - An illustration of BTCUSD bearish reversal sell signal at H4 timeframe:
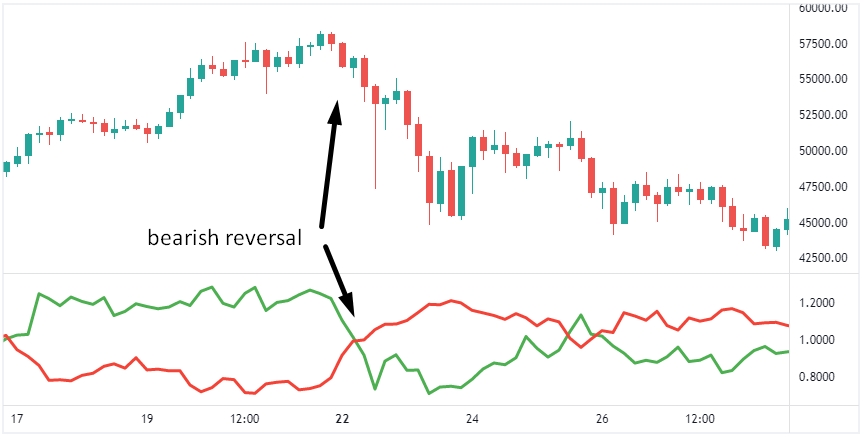
A pattern of BTCUSD bearish reversal - And here is an example of BTCUSD change from a downtrend to an uptrend on D1:
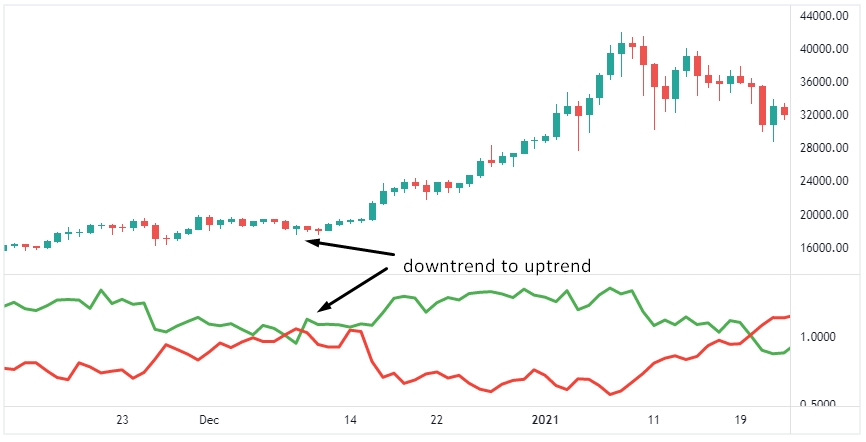
An example of BTCUSD downtrend to uptrend switching - Example of BTCUSD change from an uptrend to a negative trend movement on D1:
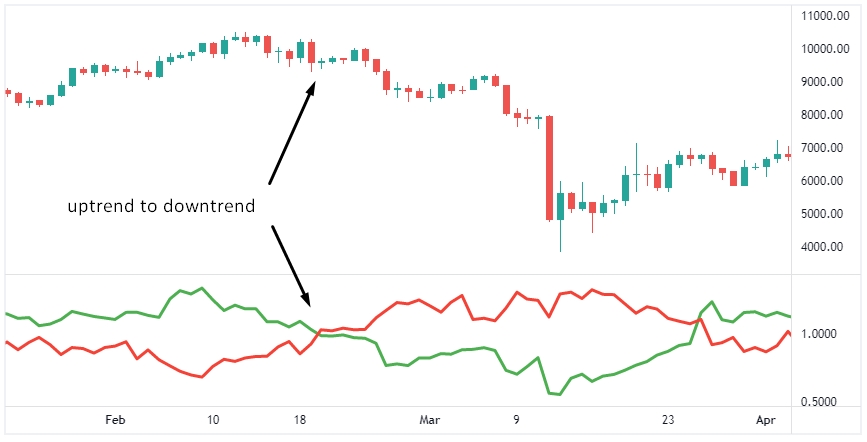
BTCUSD changing from uptrend to downtrend
Summary
Although the Vortex indicator does not have such a rich history as the more classic and widely known technical analysis indicators and patterns, if you master it, it can provide you with a certain advantage in the market. The main thing is to fulfill two points. First, to understand which style of using the technical indicator is more suitable for your trading strategy. This means that the choice of short-term or long-term trading and market analysis will depend on the used timeframes and indicator settings. And secondly, always use additional tools to get confirmation of the Vortex indicator to avoid false signals. In this combination, this indicator will definitely be able to improve your trading results.