Content
- Recognition of Wedge
- Characteristics according to classical technical analysis
- Rising Wedge
- Uptrend
- Downtrend
- Falling Wedge
- Uptrend
- Downtrend
- Rising Wedge
- Wedge pattern trading strategy
- For maximum efficiency
- Elliott Wedge
- Conclusion
The modern trader has a wide variety of chart patterns in his arsenal. Some are fairly easy to spot and trade, such as a head and shoulders or a triangle. They are quite common and easily recognizable, therefore, they are the most attractive for trading. However, today we will talk about wedges – patterns that traders argue about.
It’s no secret that the more a pattern matches the rules of its formation and the more it fits the description, the better its realization will be. Some templates seem familiar, but at the same time, there is confusion in their application, since not everything is always unambiguous, especially in the market. This include a wedge pattern, which can have completely different meanings and often its development depends on where it was formed. This is a complex pattern often associated with the Elliott Wave Theory. Therefore, before trading wedge, it is recommended that you first simply observe the formation process itself, make an assumption and only then see how correct it was.
Recognition of Wedge
Unlike a Triangle, a Wedge pattern has the direction of both trend lines in the same direction (either both lines are directed up, or both – down). Unlike a Pennant, a Wedge does not have a so-called flagpole. That is, if you add a flagpole to the Wedge figure, you get nothing more than a Pennant.
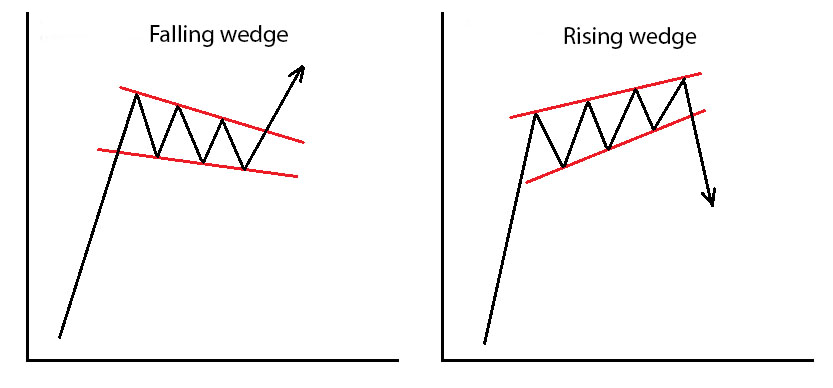
The key point is that trend lines narrow as the pattern forms and sooner or later will cross if continued. Both lines should slope up or down and there should be no near-horizontal trend lines. A horizontal upper or lower trend line indicates a horizontal triangle. So, converging trend lines in one direction is the main distinctive feature of rising wedge or falling wedge patterns.
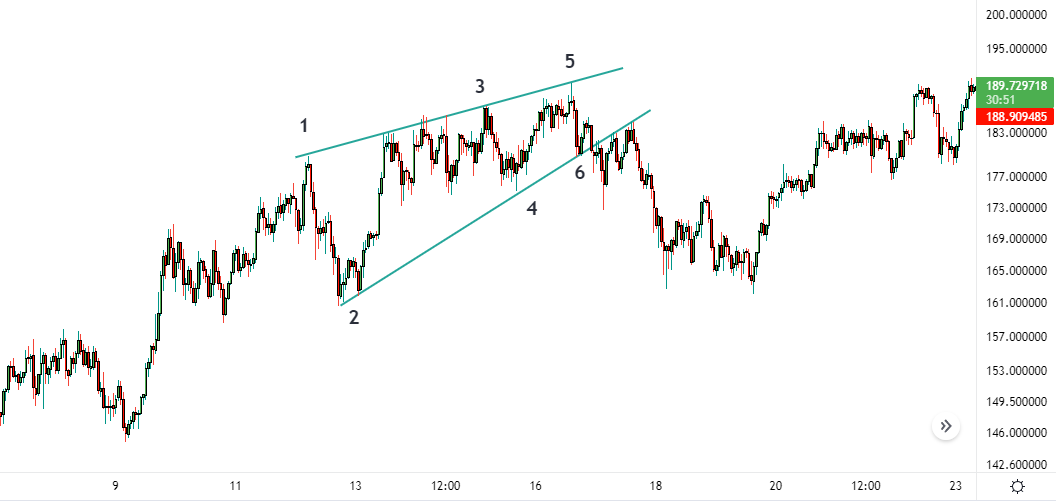
Let’s follow the formation of Wedge pattern step by step (on a bullish trend, for example):
- First, we have a trend, then we will take any bullish movement as the beginning of the wedge pattern.
- After that, a minor correction occurs, which we will designate as the second wave.
- Then the trend resumes and makes a high above the previous high. Let’s call this movement wave 3. In this case, most likely we will see divergence on the RSI or MACD indicators.
- Then a rollback follows again, and we can already draw two converging trend lines. We have 4 touch points and we can assume that we are dealing with a Wedge pattern.
- After the second rollback, the price moves up again, forming a new high. Thus, we get 5 points of contact, which alternate with each other. 3 points on the upper trend line and 2 on the lower one. This gives us the right to assume that we are dealing with a wedge. In addition, we may already have a double bearish divergence, which is an additional strong reversal signal.
Classic technical analysis
The Wedge pattern is either a classical chart pattern or an Elliott wave theory pattern. We’ll talk about the Elliott Wedge later. And if we consider the classic Wedges, then we will not turn to anyone better than Thomas Bulkowski. This man researched tens of years of charts, found more than a thousand Wedge models and summed up statistics for all market situations.
Rising wedge
Uptrend
Rising wedges form when the price makes higher highs and higher lows while trading range narrows. Rising wedge pattern or an ascending wedge is a bearish pattern in any case.
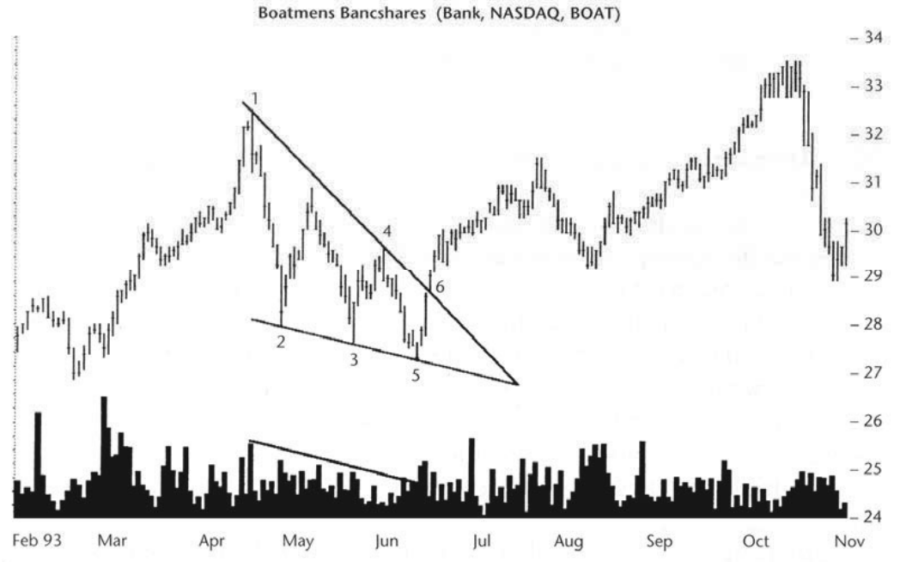
In the example, we see a rising wedge consisting of 8 alternating points of contact. In fact, there can be a different number of points, however, Bulkowski notes that 5 points is the minimum for chart pattern validation.*1 If there are less than 3 points on one side and 2 on the other, then you need to be skeptical about this figure. It may not be a wedge at all.
If an uptrend forms a rising wedge, then we usually expect a bearish reversal. In that case the price breaks the lower line and drift to the level of the pattern base (point 2 in the example above). Such chart patterns are called reversal patterns, as a rising Wedge initiates at least the beginning of a bullish trend local correction.
Downtrend
If a rising Wedge formed during a downtrend then this is not a reversal, but a continuation pattern.
In that case the entire rising Wedge is a correction, the breakout of which will continue the main downward trend.
Breakout gaps improve the effectiveness of patterns provided that the breakout occurs in the direction of the market trend.
Falling Wedge
Uptrend
If a falling Wedge pattern is forming in a bull market, then this figure is called a continuation pattern.
It is a bullish pattern as the whole pattern is price consolidation. A breakout is expected through the upper resistance line of the pattern. The falling Wedge pattern is also a rare formation. Once price breaks out to the upside, it rallies and quickly rises above the top of the formation. Very often prices continue to rise after that.
Downtrend
Falling Wedges formed after a downtrend indicate a bullish reversal.
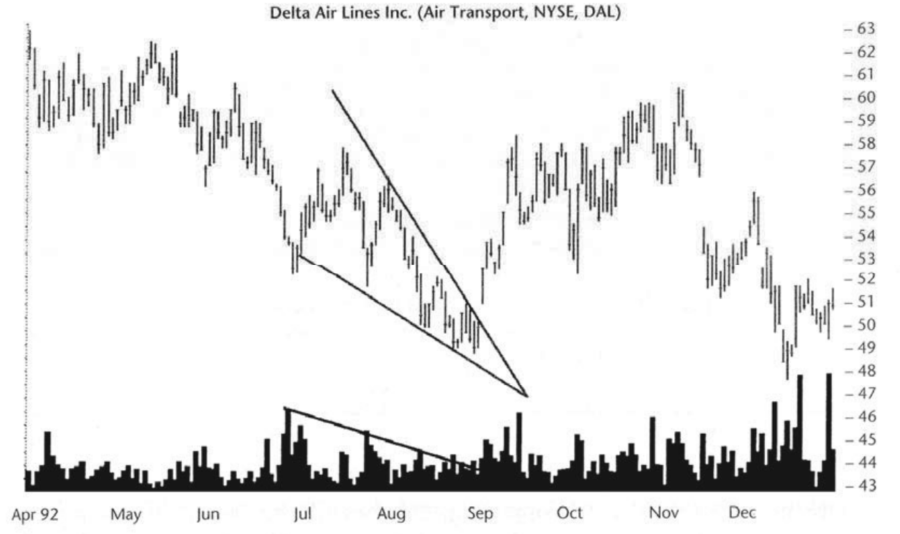
In the picture, we see two trend lines converging downward and a natural breakdown in the opposite direction.
Please note that at the time of the breakout, the trading volume increases. This is an additional confirmation signal.
In some rare cases, there is a quick breakdown of the support line and a quick return of the price to growth. That is, the breakout of the upper line does not take place immediately, but after knocking down the stops of the bulls.
Wedge pattern trading strategy
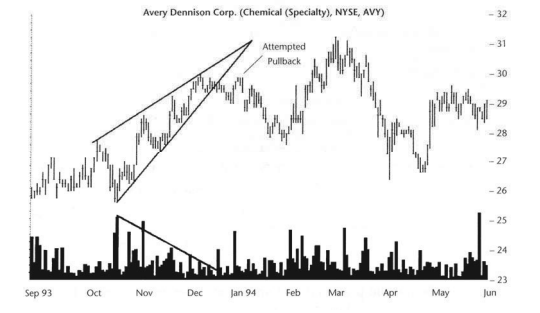
How to trade rising and falling wedges? First, you need to determine the direction of the trend and find out if the wedge is part of it or a correction.
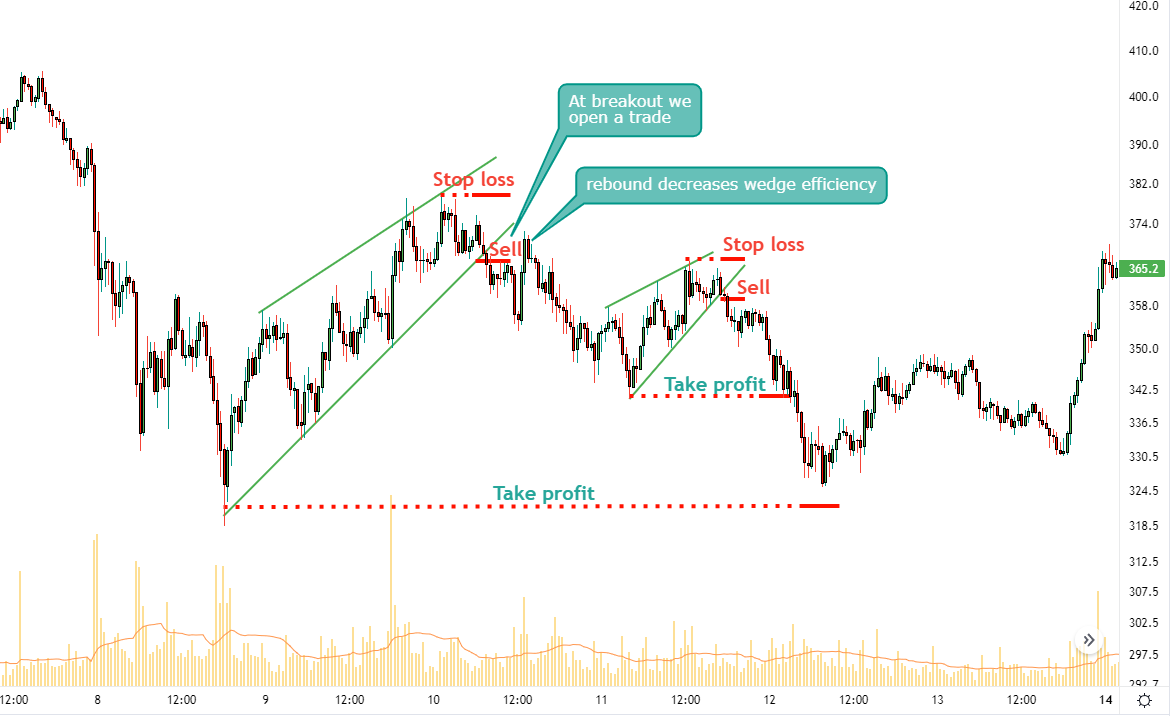
In the picture above, we can see that we have a Wedge correcting the trend. This means that we expect a bearish breakout and the continuation of the downward trend. We open a trade at the moment of breaking through the support line of the wedge, and set a stop loss beyond the extreme point of the Wedge. The opening of a position occurs at the moment when the price has confirmed its exit outside the pattern (this means that a candlestick should be closed outside of it). Alternative entry – at the moment of testing a broken line. We place Take Profit to the bottom of the pattern.
The price usually hits the target 70% of the time.
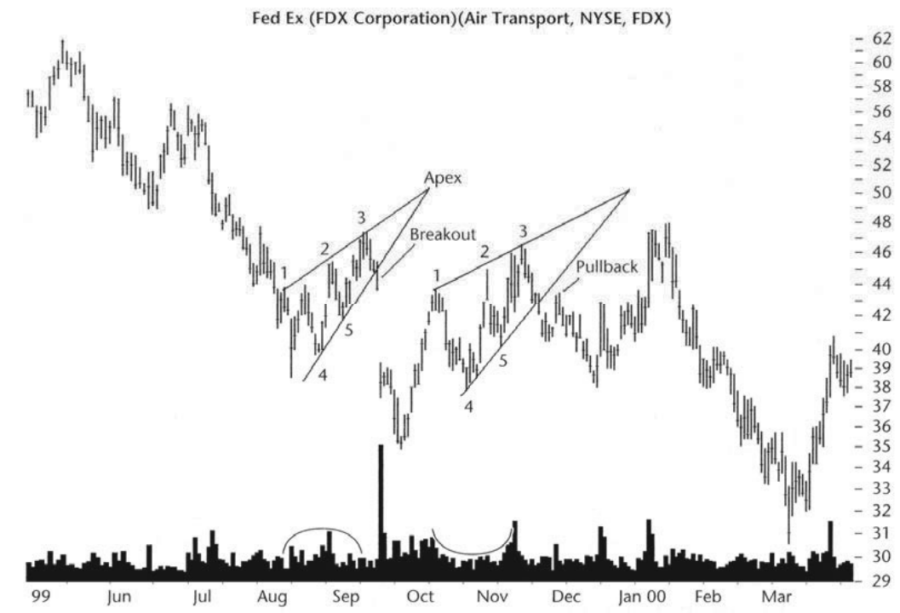
Let’s look at another example.
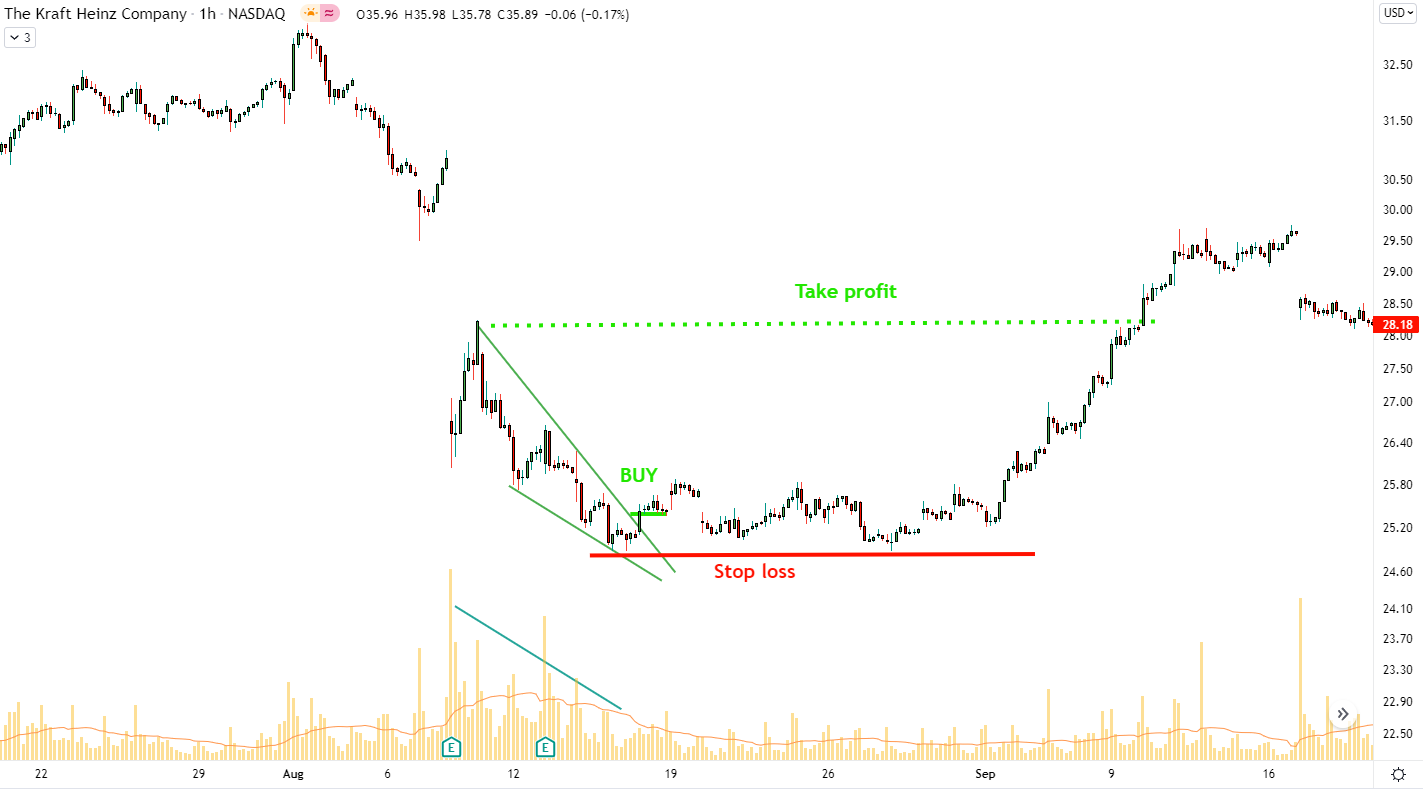
Here we see a falling Wedge, the pattern is a reversal as it is part of a bearish trend. The logic of the trade is no different. We enter a position on a breakout, do not forget about stop loss and place Take Profit on the base of the pattern.
Pay attention to the traded volumes. As the Wedge pattern forms, the volume decreases, and this is a sure sign that we have identified the wedge correctly. In general, the volume profile plays an important role in pattern validation. A fall or rise without volume in conjunction with a Wedge pattern is a very strong signal of trend weakness. Divergences on oscillators will also tell us about this, if we used them to analyze this section of the chart.
For maximum efficiency
- Wedges are almost equally divided between reversal and continuation patterns.
- Upward breakouts usually occur at reversal wedges, and downward breakouts usually occur at continuation wedges.
- Reversal wedges work better.
- Wide and tall patterns work better than narrow and short ones. Avoid short patterns.
- Bear markets tend to decline faster than bull markets rise, so if the wedge breaks down, you shouldn’t sit in the trade for too long. Be ready to take profit quickly.
- Make trades in the direction of the market trend.
- Look for confirmation of wedges in the volume indicator.
Elliott`s Wedge
It’s time to talk about the Elliott wave theory and the wave wedge.
Diagonal triangles in wave analysis are figures that are formed only at the beginning and at the end of a trend and which are somewhat different from the usual impulse.
There are Leading diagonals and ending diagonals.
As the name suggests, Leading diagonals are formed in the first impulse wave or A wave of the correction. Ending diagonals are formed at the end of a trend or in С wave of a correction.
The forming lines of the diagonal triangles in their shape resemble a wedge-shaped figure and therefore they are also called wedges.
Ending Diagonal trading
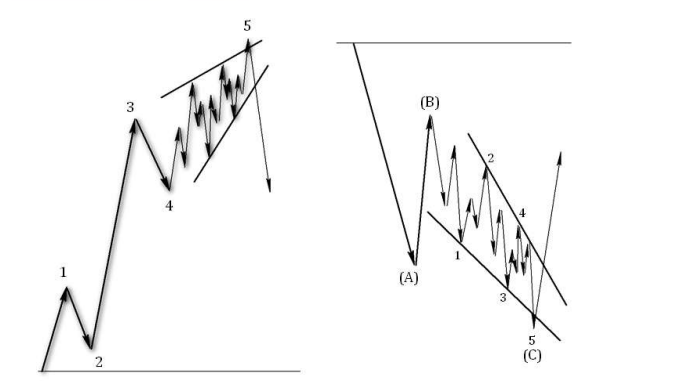
The wedge of the ending diagonal is the end of the trend. This is the most interesting and convenient place to trade the pattern. According to Elliott’s theory, a similar pattern is formed in the last wave of an impulse or in the last wave of a correction. Accordingly, this means the end of the local trend. And in some cases, a mid-term or even long-term movement arises. Therefore, the wedge that appeared at the end of the trend is very profitable to trade – we have forming lines, we understand where to place the stop. But as for the take profit, it can be set many times farther than the base of the wedge, as a graphic figure. When we catch the end of the trend in the form of the final diagonal, the potential of the wave wedge is revealed to the maximum.
Trading features of the Leading Diagonal
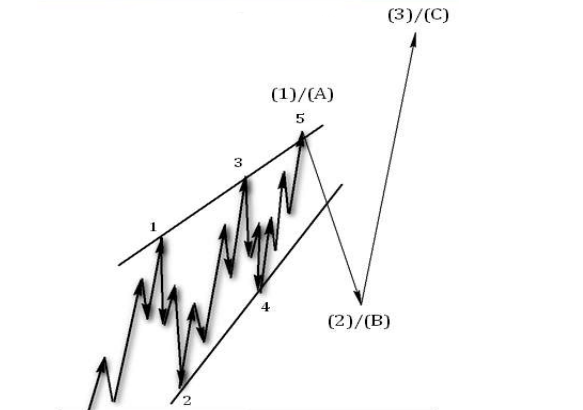
The leading diagonal marks the beginning of a new trend or the beginning of a correction. If the leading diagonal is the first impulse wave, then we can trade the reversal only within the second wave. That is, we can take the maximum profit at the end of the second wave. But as we know from the Elliott wave theory, the second wave cannot go beyond the beginning of the first wave. That is, it is unlikely that the main target for the Wedge pattern (its base) will be achieved.
Similarly, it is unlikely that the target will be achieved when the wedge is the starting diagonal in the ABC. However, the price can go beyond the beginning of wave A in case of a flat correction.
In either of these two options, we are trading counter-trend movement, which is undesirable for effective trading.
In my trading, I do not open positions at the leading diagonal, I do not want to trade corrective waves, as they are the most unpredictable. If I see a wedge formed, which is probably a leading diagonal, I wait for its correction to complete and only then I open a position (along the wedge trend).
Conclusion
All wedge trading strategies have the same basic principle. It is based on standard reversal pattern trading. The stop is placed behind the top of the pattern, and the take profit is placed at the bottom of the wedge. However, as we found out in the article, the location of the pattern is of the greatest importance, namely, in which phase of the market we are trying to analyze the pattern. And not every two lines narrowing in the same direction are a Wedge pattern.
Trade with the trend, use the volume indicator and pay more attention to Wave Wedges. Use these tips and those in the column “For maximum efficiency” and may the profit be with you.
*1 Encyclopedia of Chart Patterns (Wiley Trading) 3rd Edition https://www.amazon.com/gp/product/B0921PN8GW/ref=dbs_a_def_rwt_bibl_vppi_i0