Technical analysis is one of the most important tools that allow an investor to obtain the necessary data to increase profitability. Do not be surprised, but mastering the art of technical analysis is not that hard.
To identify trends in price movements and changes in the volume of actively bought and sold securities, you must master the principles of statistical trend analysis. In this article, you will learn a great and simple tool – the Coppock Curve.
The Coppock Curve indicator is a long-term momentum indicator used to gauge the beginning of a new bull market. Economist Edwin Coppock concluded that downturns of the market lead to frustration, a kind of grief, among investors. Although this indicator is useful enough, it is not often discussed among many technical analysts. Traditionally, it is used to detect long-term trend changes in major stock indices. It is very effective in trading S&P 500 and Dow Jones.
Today we will find out if it’s possible to trade Bitcoin or Ethereum with the Coppock Curve analysis. Do not forget to follow the recommendations and strategies from this article to do momentum investing yourself on our platform.
Article contents:
- What is the Coppock Curve Indicator?
- How to use CC?
- CC in your Trading Strategy
- How to access CC on FYBIT?
- Advantages and Disadvantages of Coppock Curve
- Conclusion
What is the Coppock Curve Indicator?
As you can see from the name, this momentum indicator developed by Edwin Sedge Coppock and published in Barron’s magazine in October 1965. As a follower of the Episcopal Church, he was looking for long-term investment opportunities on behalf of the Episcopal Church.
When asked how long it usually takes people to recover from the death of a loved one, Coppok received the answer that the average mourning period is 11 to 14 months. Based on these numbers, Edwin Sedge Coppock equated market downturns with a mourning period. In other words, the Coppock indicator provides trading signals about the end of the mourning period in the market after a long recession.
The Coppock Curve is simply a smoothed momentum oscillator for long-term analysis that does not produce very many signals, especially in the monthly chart.

Coppock Curve Formula
This momentum oscillator aims to identify entry signals by analyzing market activity on monthly charts. After adding the rate of change (RoC) of the short and long periods, the Coppock Curve calculations are smoothed by the weighted moving average.
The formula is as follows:
Coppock Curve Formula = WMA[10] of (RoC [14] + RoC [11])
Note that the 10-period weighted moving average puts more weight on the most recent data and less weight on the older data.
Settings
Default Settings are: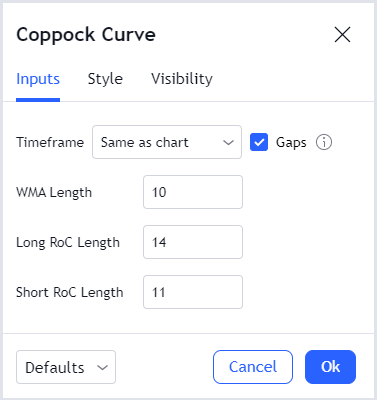
The default indicator settings work well if you use monthly data, but may not be as efficient if you use weekly data or shorter time frames.
To make the Cappock indicator faster, set the rate of change (RoC) indicators to 10 and 7 instead of 14 or 11 so that the curve gives more weight to recent price movements. Reducing the rate of change variables increases the rate of indicator moves.
If you increase the RoC values, the fluctuations become slower, which reduces the rate of the signals. If you want to get earlier entry and exit signals, decrease the WMA value. By decreasing the weighted moving average to 6 instead of 10, the entry signals will come a little earlier on up moves. Exits and potential short trades will come slightly earlier on downtrends.
How to use CC?
Like most oscillators, the Coppock Curve has 3 main signals:
- Change of direction
- Cross of the zero line
- Bullish and bearish divergences
In the following examples, we use daily charts & weekly charts.
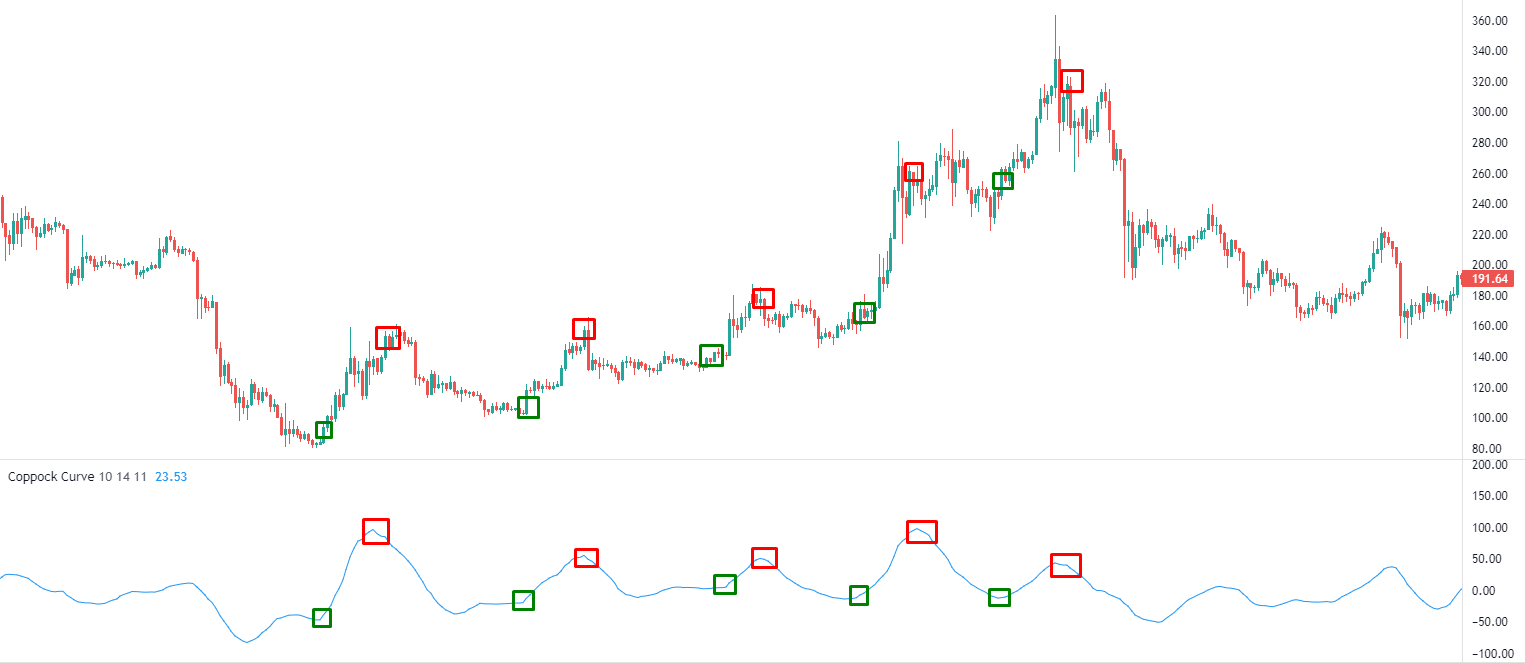
Change of direction
It is a very simple and standard trading signal – when the line of an indicator changes direction, it is a signal to enter the market. A downtrend followed by a rise in the line is a buy signal. A sell signal triggers when an uptrend is followed by the formation of a mountain and the subsequent decline of the CC line.
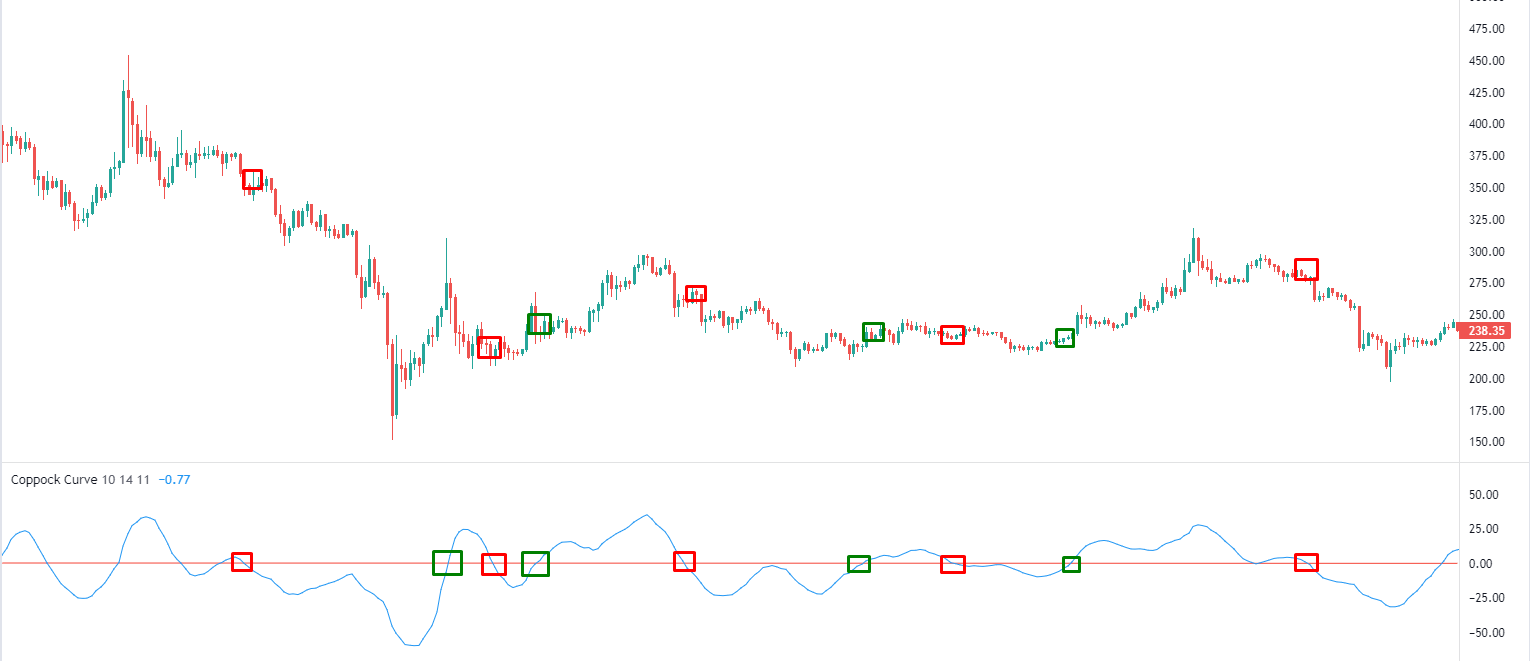
Cross of the zero line
Another trading signal is generated when the Coppock Curve crosses the zero line. The zero line divides the oscillator into a positive territory & negative territory and provides a bearish & bullish crossover.
- When the indicator crosses the zero line downwards, it indicates a prevailing bear market.
- When Coppock Curve crossed the zero line upwards, it indicates a prevailing uptrend.
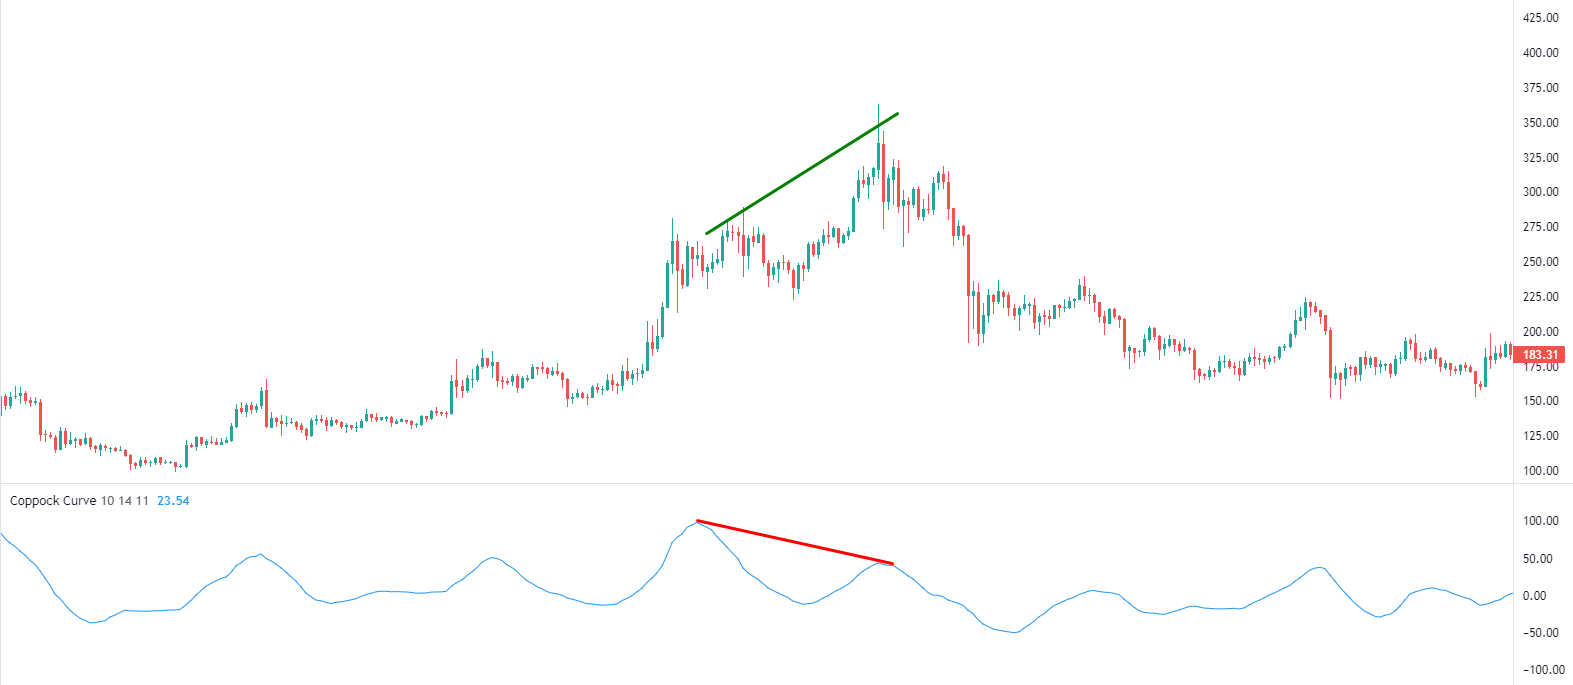
Bullish and Bearish divergences
Like all oscillators, the Coppock Curve can be used to look for price divergences and indicators called divergence. These signals are generated when price forms a new top or bottom without the indicator reaching the corresponding extremes. This type of trading signal indicates if the current trend is weakening and either a trend reversal or correction is imminent. The indicator shows divergences and can be used to detect trend reversals.
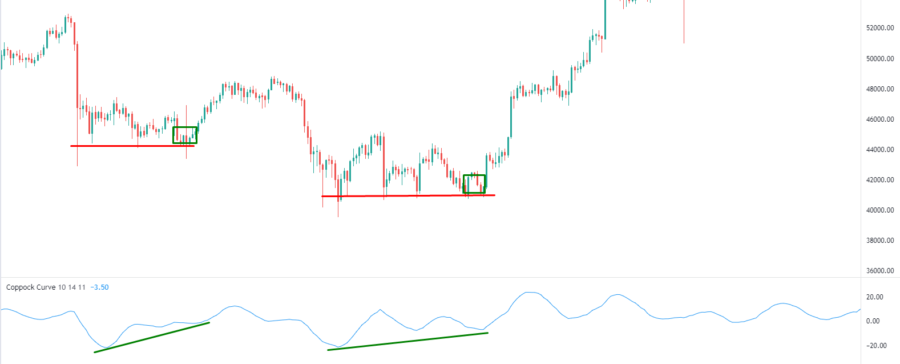
On the chart below you can see how the last two bear markets ended with bullish divergences. Both examples with the same direction are excellent buy-signal triggers: the price bounces off the minimum extreme and tries to go back down, but cannot fall any further. The first data point is the correction and another data point leads to the final trend reversal (picture #5).
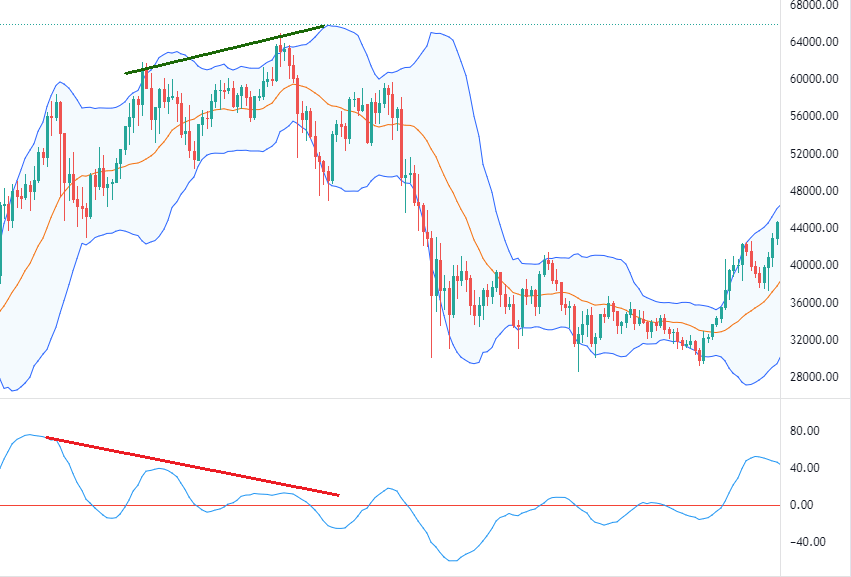
In picture #6 we see the opposite pattern. On this daily ETH/USD chart you can observe classic divergence of the “bears” revealed by the Coppock Curve Oscillator.
Such divergences provide appropriate buy & sell signals, but still, it is recommended to filter each of the considered trading signals with the help of additional indicators and not to rely only on a Coppock Curve.
CC in your trading strategy
Most traders are already convinced of the practical efficiency of using buy and sell signals of Coppock Curve strategy in their trading. Here we will discuss universal tips that apply to either the S&P 500 and Dow Jones or crypto trading.
Using the indicator as a filter gives a huge opportunity to significantly increase his efficiency. Revealing the direction of the trend, which is determined with the help of the CC gives the trader an indication of the direction in which it is advisable to trade and in which it is better to be patient and wait for a more favorable buying and selling moment. For example, when the curve moves from positive to negative territory, you can trade in areas with a pronounced trend and enter the market in the direction of the main trend.
As you can see in picture #7, the end of the trend is associated with the occurrence of a bear market divergence. If the daily and weekly data prove that the trend has changed, we can open short trades. When the CC line crosses the zero line from above, that is our sell signal. If the trend is not pronounced and the price is in the flat zone, a trader can trade on a change of direction of the histogram near the boundaries of the price channel identified by the Bollinger Bands indicator or other technical indicators.
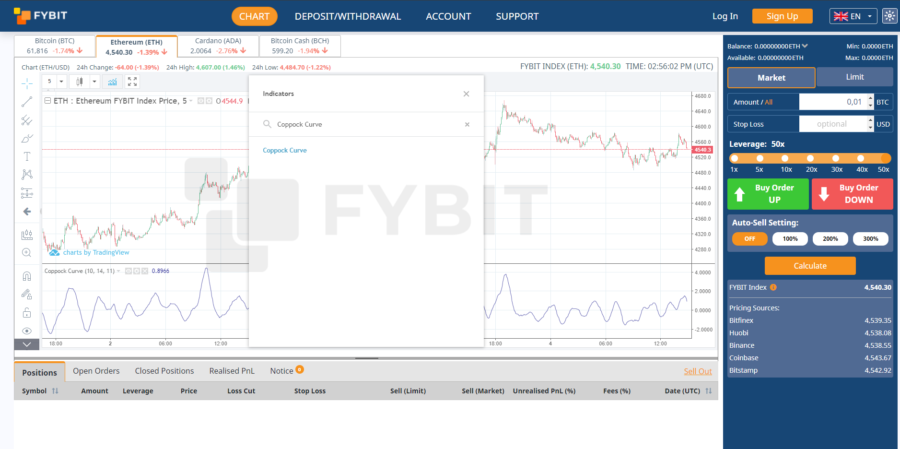
How to access CC on FYBIT?
In order to access the Coppock Curve go to our main page and open the chart. Click the “Indicators” tab and enter “Coppock Curve”.
Most trading platforms usually have the same issues – lagging platforms or bots in the support team.
FYBIT is the platform where you will forget about these issues and will be satisfied by trading itself.
We recommend you our trading platform and hope you will enjoy it.
Advantages and Disadvantages of Coppock Curve
The CC indicator has the same advantages and disadvantages as many other technical indicators.
Advantages:
- Suitable for holders or those looking for buy signals through monthly data.
- Simple signals from which you can easily build a mechanical strategy.
- Allows you to identify important trends.
Disadvantages:
- A large number of false signals.
- When trading the signals of the indicator, you can not expect a serious profit.
Conclusion
The Coppock Curve is a simple smoothed momentum indicator. We have shown and discussed with examples how you can apply it and use it with maximum efficiency on the cryptocurrency market.
If you are familiar with trading the Coppock Curve, you can add it to your chart on our platform. However, to increase the profitability of your trading, we recommend you use other indicators too.
We hope this tool will help you maximize your profits. Check Coppock Curve and trade with profit, good luck.