Quick Link To Content:
- What Does Awesome Oscillator mean?
- Displaying the chart in the terminal
- How to interpret AO readings?
- Basic Awesome Oscillator Trading Strategies
- AO as an element of Profitunity
- Conclusion
What Does Awesome Oscillator mean?
This market momentum indicator was invented by Bill Williams in the 1970s and got a rather provocative name. In those times, it was one of the best indicator to measure momentum on stock and commodity markets.
Awesome Oscillator (AO) helps to determine market momentum by subtracting a typical price of a faster 5-period simple moving average from a typical price of a slow 34-period simple moving average.
Awesome oscillator formula: АО = SМА(5) — SМА(34)
Generally, moving averages use closing prices of candles in their formulas. However, this indicator calculates a Typical Price. What is it? The sum of the maximum price, minimum price and candlestick closing price must be divided by 3. The resulting value will be a Typical Price. Some platforms use Median Price in calculation instead of a Typical Price. Median price = (High + low) / 2
An important feature of this indicator is that settings cannot be adjusted. The parameter of number of periods (5 and 34) was set by Bill Williams himself and, according to the creator’s assurances, is suitable for use in any trading situation.
On the one hand, the indicator demonstrates well the oscillatory effect, since the fast 5-period simple moving average shows fluctuations around the slow one, and on the other hand, using the typical price instead of closing prices makes the indicator smoother.
Displaying the chart in the terminal
Awesome Oscillator indicator is usually available in most trading platforms. It consists of a zero line, a scale and a histogram. Note that the scale is composed of absolute values that reflect the difference between typical prices of an asset. This is in contrast to the stochastic indicator, which is limited to -100 and +100.
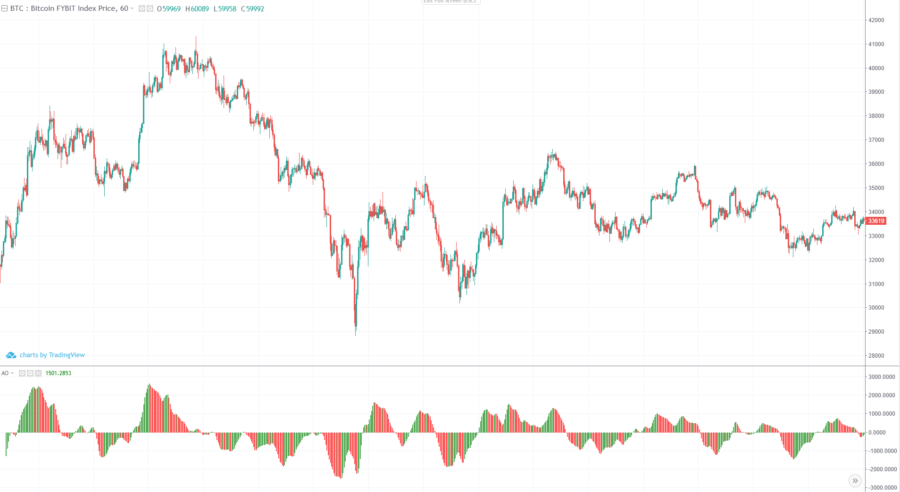
As we already wrote, for calculations, you need 5-period and 34-period simple moving averages. The platform indicator uses SMA 5 and SMA 34. If the difference between SMAs has increased after the close of the current candlestick on the chart, then Awesome Oscillator draws green bar for a bullish trend and red bar for a bearish trend. Conversely, when the range between two movings narrows on a bullish trend, the instrument draws a red bar and a green one on a bearish trend.
Many article authors believe that green bars represent bullish momentum, while red bars represent bearish momentum. However, this is their massive delusion, which appeared as a result of negligence in the analysis of the indicator’s operation. In a bullish trend, the red candles only show the fast SMA approaching the slow SMA. That is, a price on a chart can go sideways or slightly up, and candles will be red. What is this bearish momentum? This is fundamentally wrong. Bearish momentum can only be talked about when Awesome Oscillator indicates negative values below the zero line.
Awesome Oscillator is very similar to another indicator – MACD. But MACD takes into account closing prices, while Awesome Oscillator indicator takes average prices into account. Therefore, the readings of these instruments differ from each other.
How to read the Awesome Oscillator?
Traders believe that the slow SMA shows the trend with its slope, while the fast SMA shows the direction of price fluctuations within the trend and gives an idea of whether bullish or bearish forces are currently driving the market.
When the price moves along the trend, the AO moves away from the zero line, indicating that the trend is full of strength. When the price begins to correct, the AO begins to approach the zero line, indicating that a corrective movement is starting.
If the fast and slow SMA cross (the awesome oscillator crosses the zero level), then this situation indicates a change in the dominant group of trading participants. If the price forms a new extremum within the trend, and the AO duplicates this extremum update, then the trend is safe.
If the price gives a new extremum, which is not confirmed by the indicator, then such a situation indicates a weakening of the trend and the possibility of its reversal in the near future.
Basic Awesome Oscillator Trading Strategies
Zero line crossover
I think that the reader understands that the trade should be made in the direction of the crossover.
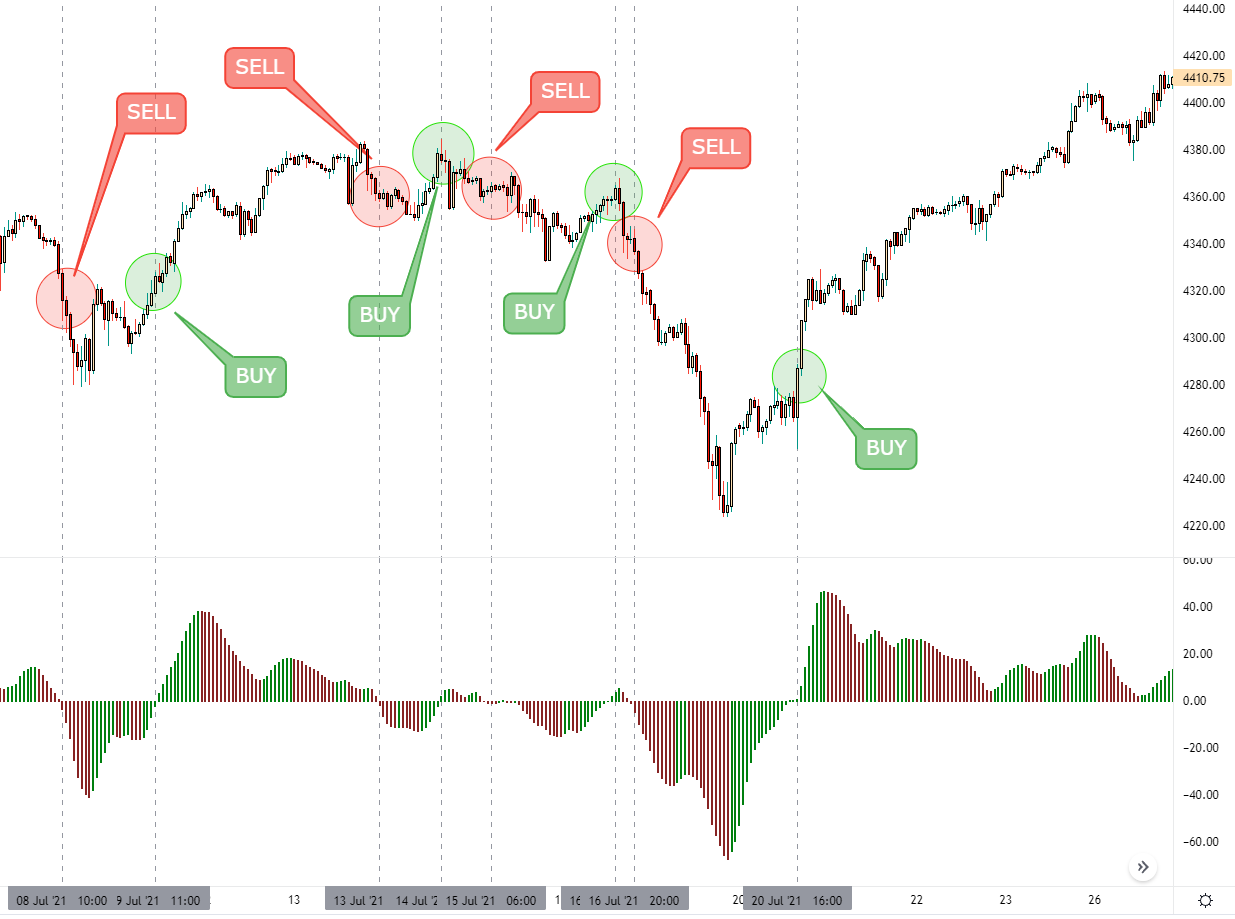
On the example, we see expected entry points in positions, if we are guided by such a signal system. I’ll make a reservation right away that I spent some time looking for an illustrative example of how this technique works, since many trading assets are not suitable for working with this indicator. The indicator turned out to be too demanding on volatility of an asset and strength of its trend. Namely, the indicator generates a huge number of false signals on assets with average or high volatility. Also, the awesome oscillator produced a huge number of errors outside the trend.
In the example above, even on a good section of the chart, we see at least 4 false bullish and bearish signals by zero line crossover strategy.
Awesome oscillator + moving averages
Next, we will try to reduce the number of signals that we do not need by adding a pair of SMA with periods of 12 and 30 to the chart. The number of periods and MA type were not chosen randomly, but by manual selection of the most effective parameter. They will act as a strainer and will filter out AO signals generated outside the trend.
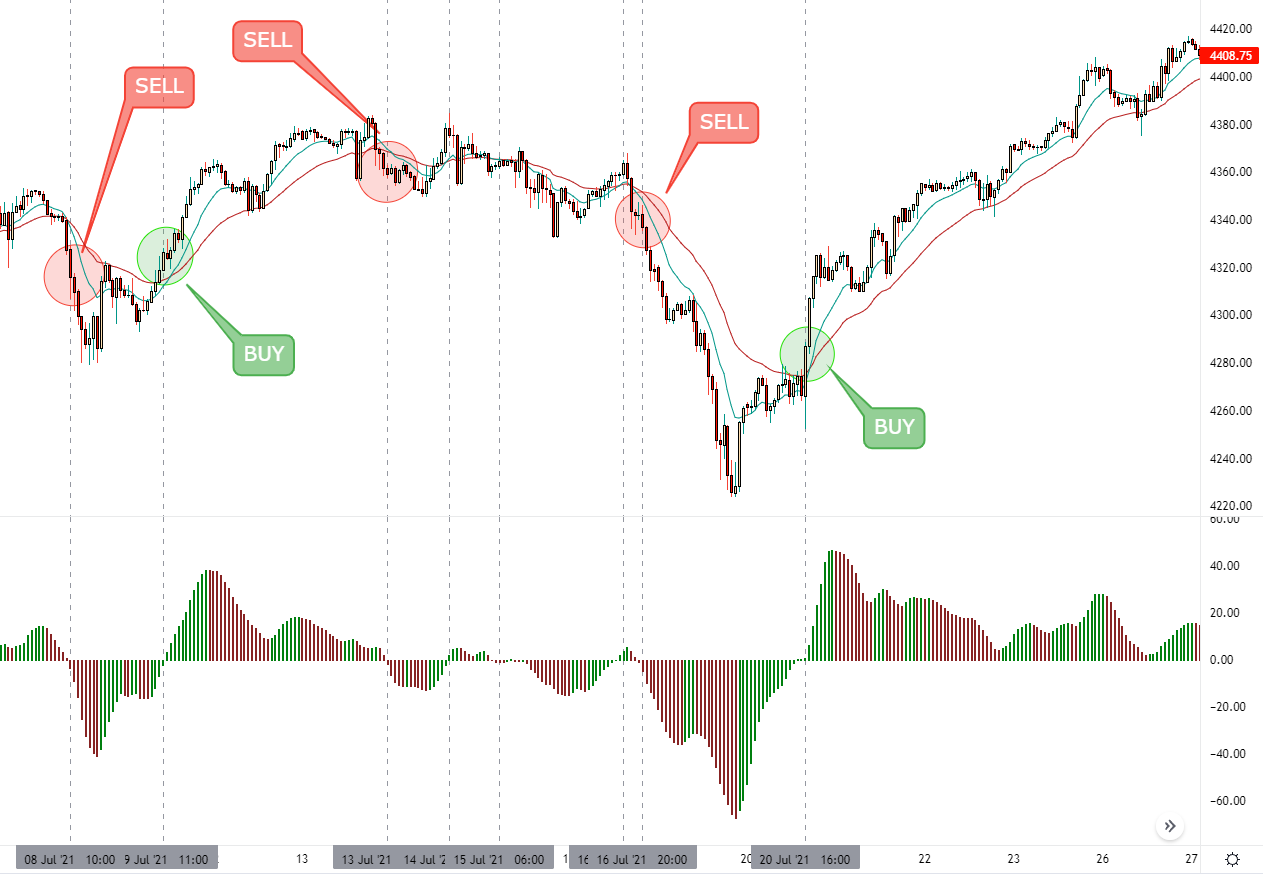
SMA indicate an uptrend if the 12 SMA is above 30, and a downtrend if the 12 SMA is below 30. 12 and 30 SMA will serve as a trend filter, that is, buying on the AO indicator will be made only on an uptrend (or when SMA12 crosses SMA30 from the bottom up), and selling – on a downtrend (or when it crosses from top to bottom).
In such a system, there will be fewer trading signals for making deals, but they will be more accurate – I thought.
And I was only partially right. On the one hand, the number of false signals has decreased, but on the other hand, the indicator’s efficiency has still not increased to the level I require.
“Saucer” Strategy
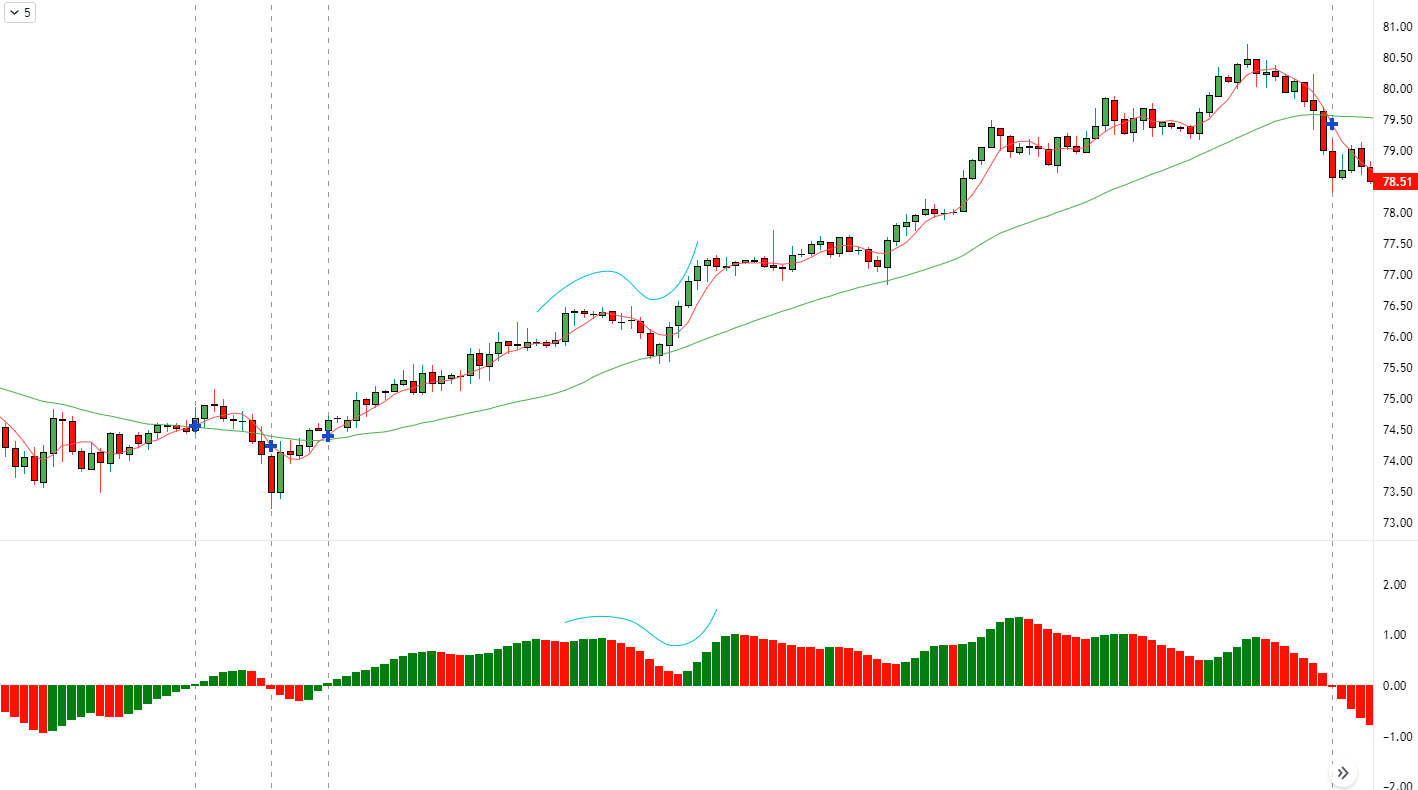
Awesome Oscillator saucer is the only bullish signal that occurs when the histogram is above the zero line.
Remember the following:
- The “Saucer” signal is generated when the histogram changes direction from descending to ascending. The first column is red. The second column is lower than the first and is colored red. The third column is higher than the previous bar and colored green;
- to generate the “Saucer” signal, at least three histogram bars are required.
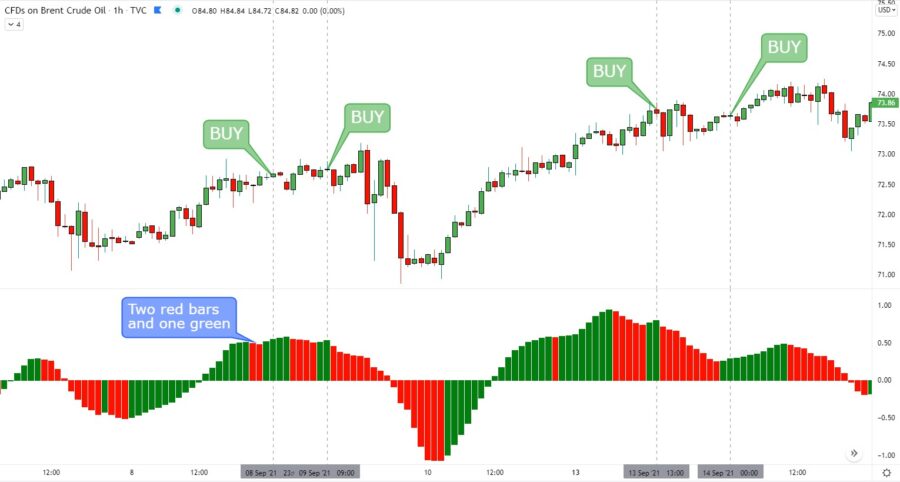
Remember that when using the “Saucer” buy signal, all Awesome Oscillator bars must be above the zero line.
This signaling system raises questions no less than the previous two. Since the indicator is lagging, its “Saucer” signals are often generated on highs, so a deeper correction can come at any time. The “Saucer” signal does not show the strength of the trend, does not give a good probability of further price movement. In addition, we do not have an exit signal, as this strategy only works along the trend. In addition, the “Saucer” effect is too short-lived. Awesome Oscillator trading strategy shows not an awesome result.
“Twin peaks” or Divergenсes strategy
Awesome oscillator “Twin peaks” is the only buy signal that can be generated when the histogram values are below the zero line. The following should be remembered here:
On a bullish trend: A bearish signal is generated when each new high of a price is not confirmed by a new high on the indicator.
On a bearish trend: A bullish signal is generated when each new low of a price is not confirmed by a new low on the indicator.
Let’s take an example.
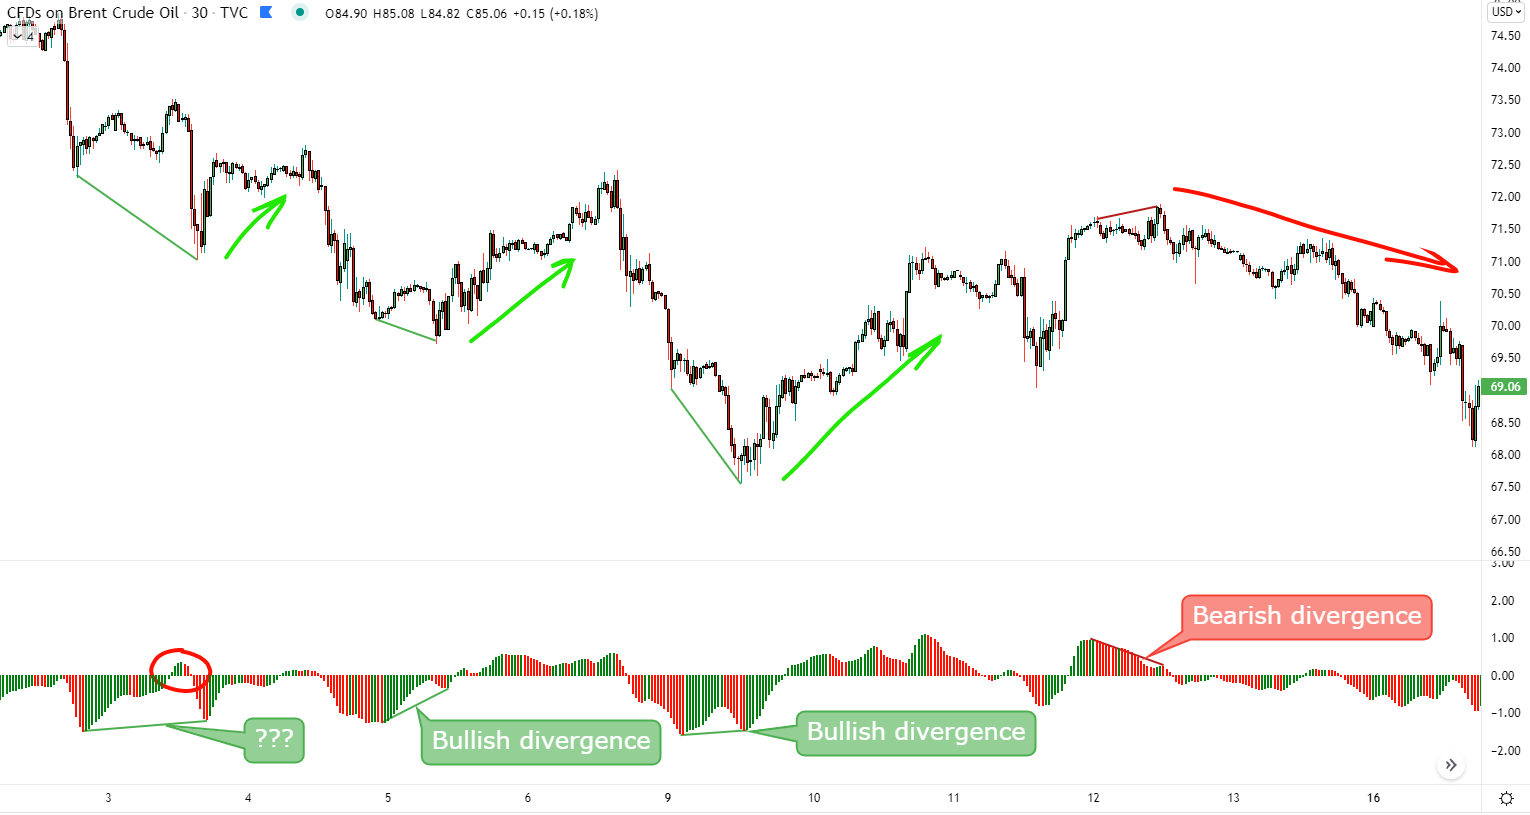
The first thing we need to do when we take a look on a price chart is to identify a trend. Visually, we determine that a downtrend is prevailing. On the chart, I connected the price lows with a green line. At each of these moments, the second peak on the Awesome Oscillator does not exceed the first. That is, there was a discrepancy between the price movement and the indicator readings, which indicates a trend fading and a possible reversal.
As we can see, all divergences, except for the first one, worked well and predicted corrections. However, is it possible to compare the first case as a divergence?
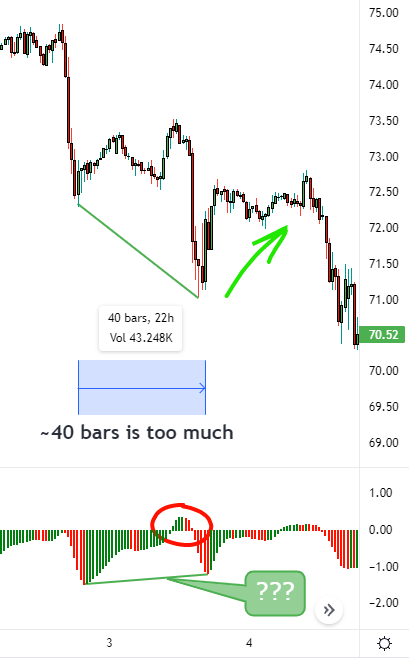
I think that it is unlikely, since before the formation of the second peak, the indicator readings managed to cross the zero line and for some time were in the positive zone of Awesome Oscillator.
In addition, there are too many bars between the indicator peaks, i.e. large time interval.
And we remember that a fast SMA uses only 5 candles in its calculations. This makes the indicator too sensitive, so for the best signals indicator`s peaks should be close to each other and values do not cross the zero line.
Awesome Oscillator as an element of Profitunity
Let’s try to return to the origins of the AO indicator. Initially, Bill Williams came up with this indicator and began to use it in his own trading strategy called Profitunity, which we will discuss below.
The Profitunity system consists of indicators: Alligator, Awesome Oscillator and Fractals.
It also uses the Bullish / Bearish Pivot Bar pattern, which looks like an evening star or morning star. There are 3 entry signals, each of which Bill Williams calls a “sage”:
- A signal from the Bullish / Bearish Reversal Bar
- A signal from the Perfect Oscillator
- A signal from fractals.
The Alligator is just an advanced trend indicator.
In this article, I will touch upon the usage of only one of the three sages – Awesome Oscillator.
In the book “Trading Chaos” the author advises using the AO trading signal as an additional one, that is, for adding to a position.
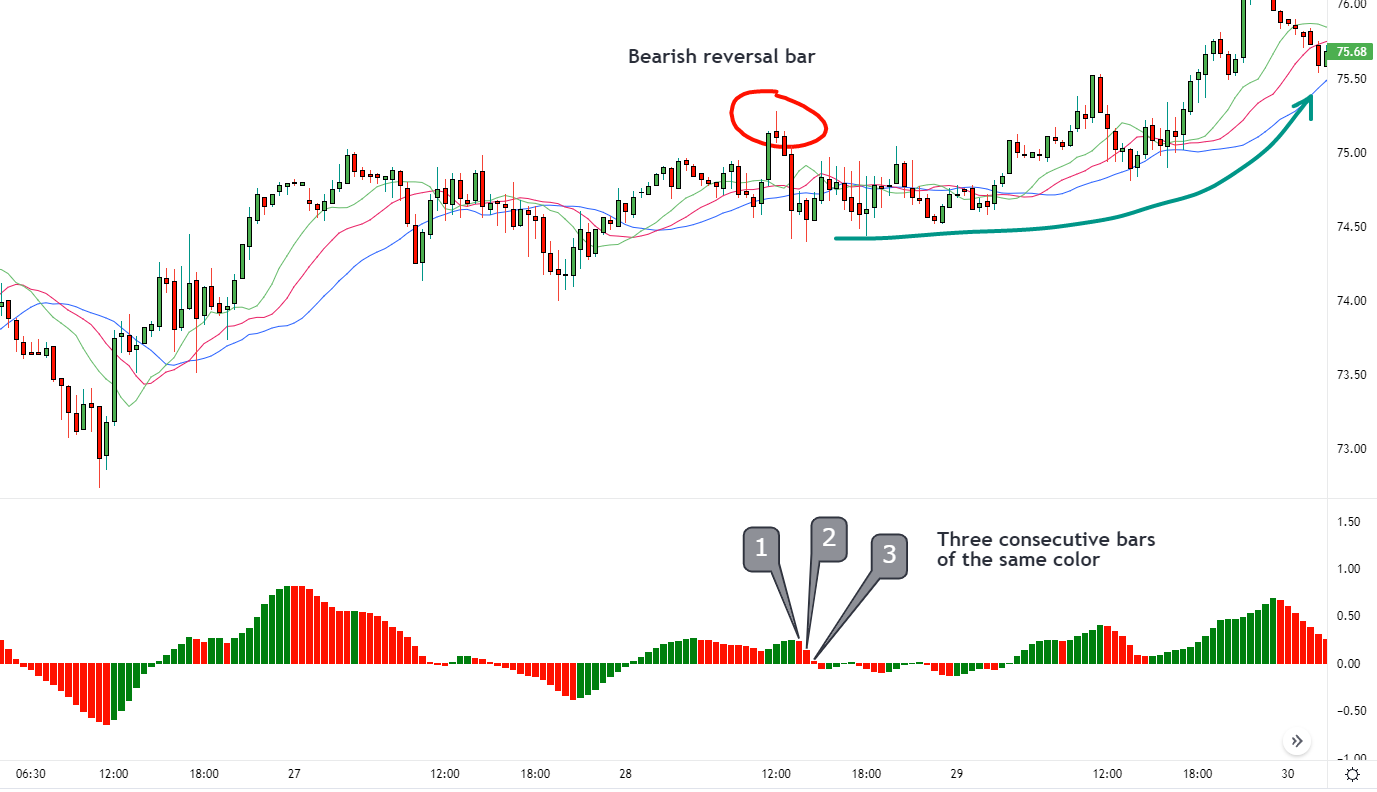
As we can see using Alligator, we have an uptrend. Three consecutive bars of the same color of the AO histogram serve as a signal to open or add to a position, also we have a reversal bar.
If we expect a change from a bullish trend to a bearish one, then at the close of the third bar we have to place a pending order just below the low of a candlestick and place a stop loss near the high of the same candlestick.
As you can see in the picture, the trend continued and the trade was closed by stop loss. In fact, this is only a small part of the Profitunity system, namely, part of the technical part. In his book, Bill Williams reveals many of the nuances of this trading system. To understand it, you need to take into account wave analysis, patterns, other indicators, combine many signals, thereby making this strategy unsuitable for trading due to its complexity. Everything ingenious is simple.
Therefore, I am not going to use Profitunity or fragments of it in my swing or day trading. But if my goal was to write books on indicators and sell training courses, then I would complicate things as much as Williams does.
Conclusion
Depending on the strategy used, this indicator can act as a lagging indicator (a strategy based on moving averages) or a leading indicator (a strategy where we measure momentum).
In my opinion, “Twin peaks” strategy is the most powerful signal system compared to the others in this article. That Awesome Oscillator strategy is separated from a full-fledged strategy only by the need to append additional tools to confirm or refute its signals.
However, the following questions arise. Why use the Awesome Oscillator when there is a more flexible and varied MACD (Moving Average Convergence Divergence)? If we are talking about divergences or measuring market momentum, why not track it with RSI, which does a lot better with it? There are several technical indicators that are similar to Bill Williams Awesome Oscillator with better trading results. I have no answers to these questions and I leave it to the reader to answer them in the comments.