- What is the True Strength Index (TSI)?
- True Strength Index formula
- True Strength Index VS Average True Range
- How to use the True Strength Index?
- Strategies
- Why you should use the True Strength Index?
- Final thoughts
In the last few weeks, we have delved deeper into some of the most interesting indicators that you can now use.
By this point, we have looked at several trading strategies. There have been quite a few examples in my articles with tips of exactly how you can create a trading system. And you must have already created your own strategy.
We looked at popular best technical indicators such as Supertrend, Chaikin’s oscillator, exponential moving average, and divergence indicator, which itself highlights the signals right on the price chart.
The time has come to spice up this trading system with something equally useful.
True Strength Index is one of the most useful indicators for technical analysis, which many people doubt. Well as we know most are wrong and only 5% of the traders are successful. Maybe they’re just not applying it correctly? What factors are traders overlooking?
When and where actually apply the True Strength Index (TSI) and receive buy/ sell signals we will define in this article.
What is the True Strength Index?
True Strength Index is a momentum indicator that uses moving averages of the underlying momentum of a financial instrument as its basis. It is essentially an oscillator that was developed by William Blau.
How to use it? It can be used in basically four ways:
- To identify key levels, where will the certain price change occur?
- Consider opening and closing position when zero line or index line is crossed.
- To determine the entry point when two TSI indicator plot lines cross each other (the same with two Exponential Moving Average).
- To identify divergences (Same method with Momentum indicator).
We recommend using the last three methods and we will even explain why this is worth doing.
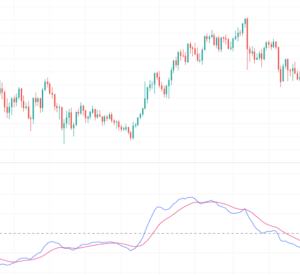
True Strength Index applied on the chart consists of three lines: one of them is horizontal, which is called the zero line, and the other two are plot lines that are painted in two different colors.
True Strength Index formula
And straight to the point. There are three basic steps to calculating the TSI.
- First, you need to calculate the change in price from one period to the next.
- Secondly, you should now calculate a 20-period (or whatever period suits you) Exponential Moving Average (EMA) of that price.
- Then and finally, you must calculate the 13-period EMA for the 20-period EMA, for double smoothed price change
Again, you do not need to know how the indicator is calculated. The most important thing is to be able to apply its signals in practice in your trading.
True Strength Index (TSI) VS Average True Range
The True Strength Indicator (TSI) is often confused with the Average True Range (ATR) indicator. Is it because they are similar in appearance as well as in function? In fact, they are not. And now we will find out why.
First of all, remember (and you will never forget) that the ATR is a price spread and therefore used as a measure of volatility. It is measured in pips, which the price has passed in a certain period of time (one 1H bar, for example).
As a result, you can use it to choose crypto actives with the already measured level of the risk that you want.
The default setting, and therefore the most common period used in calculations, is 14 days.
It is calculated using the formula:
ATR = (Previous ATR X (n – 1) + TR) / n
Where n is the number of periods and TR is the True Range.
The True Range is calculated by subtracting today’s high from today’s low. Kind of a way to measure price momentum.
The two indicators are used differently. While the True Strength Indicator is used to find entry and exit points, the ATR is mainly used to measure the volatility of a financial asset, a kind of convenient way to measure risk by a very clear metric.
How to use the True Strength Index?
CROSSOVERS, OVERSOLD AND OVERBOUGHT.
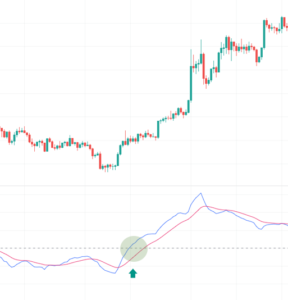
The first method is to look for crossovers, just as with Moving Averages. In most cases, when two indicator lines cross, it is usually a sign that price is starting a new trend, regardless of direction.
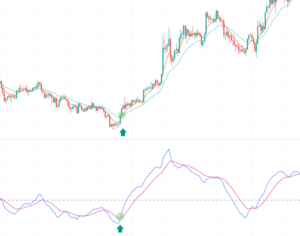
A good example of this is shown below on BTC chart. The green arrows indicate the points of these crossovers. Note that the blue line crossing the red line from the bottom up is a bullish crossover.
You can see on the chart above how the red signal line crossover the blue one creating the trading signal which shows us the trend direction. Buy signal!
Crossovers of the True Strength Indicator indicator plot lines give you quite accurate entry points on-trend and on retracements when the trend direction resumes.
Another type of a trading signal:
It is when the signal line crossovers occur.
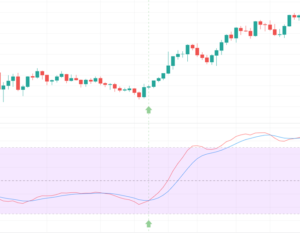
In the case above, the indicator zero line was crossed by both plot lines from bottom to top. Buy signal as well!
Another way is to identify the overbought and oversold levels. An overbought level sends a signal that you should short an asset while oversold level signals that you should buy the asset.
Another way is to identify overbought and oversold levels.
The first one is a signal that you should consider Buy Down orders play trying to make money on the fall of a crypto-asset, while oversold levels signal that you should place Buy Up orders expecting the asset to increase in value.
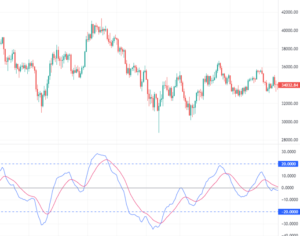
The plot lines at 20 and -20 (blue dotted lines) can be used to determine whether a crypto-asset is overbought or oversold potentially.
Regarding its general use, in fact, like other oscillators, it should only be used when the price is in a trend. Its use in a sideways movement or price consolidation is not ideal. In this case, you will often get false trade signals!
Strategies
When working with this indicator, the best entry points into the market are when there is a strong market movement, for example, are the end of a corrective movement and the resumption of movement in the direction of the trend where a reversal and trend reversal can occur, usually at a confirmed level. An example of how to identify levels will be shown below.
Proven more than once, timing is everything! A price reversal near support or resistance can be a great entry point, whether you are trading up or down. The key to the most profitable positions and the most pips.
Successful traders form a comprehensive view of the market using the following postulates:
- prices may move in a rising or falling trend or in a sideways range
- each trend reflects an active market reaction
- the range reflects a negative market reaction when the price moves between some maximum and minimum values and cannot form a directional movement
- a trend break takes place at certain points
- oscillators are used to identify a sideways movement
- impulse indicators are used to identify trends.
Let’s make a simple strategy based on the True Strength Index indicator and price levels to reduce the false signals. To do this we need to introduce concepts such as support and resistance levels.
Support and Resistance
A support level is an area where the price of an asset reverses from bottom to top. This level supports the crypto asset, preventing it to go below the level, which you can actually use to your advantage, both when entering the market and when setting protective Stop Loss orders. The same is true for the trend lines.
A resistance level is an area that, when reached from top to bottom, causes the price trend of an asset to reverse. Resistance prevents the price from going higher.
When working with support and resistance levels, it is important to remember that a price level is not a clear round figure, but a range. These indicators are key for traders because they clearly show price levels, upon the breakdown of which further price movement can be determined in 90 percent of cases.
Thus, the market moves like a pendulum from periods of a directed tendency to periods of rest in the range, gaining strength and energy for the next period of activity.
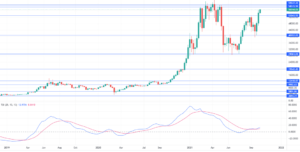
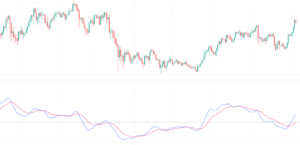
BTCUSD was in a bullish trend in 2020. After momentum and growth, consolidation zones are clearly visible. All lines above the current price are resistance lines. Also, you see that TSI indicator signal line crossover occurs, TSI line crosses the second one in the positive territory that indicates the overbought levels are very close. Get ready for the Sell signal!
Actually, this is the same method that works with two exponential moving averages that smoothing price more in a weighting way or importance to recent price data.
Identification of the current market condition gives swing traders a chance to join the general movement in the trend during a pullback and correction if the opportunity was missed when the trend started; or, if the trader already has an open position, to add new orders.
The strategy of trading at levels
Trades at levels of support and resistance are known as rebound trading within a channel.
A key support level is highlighted which has not been broken by the bears at least three times;
As you approach the support level, you decide which strategy to use: a rebound trade or a breakout trade.
The ideal is to hold the position until the price rebounds to the next level and close the trade before the rebound in order not to cut your profits.
In the event of an incorrect prediction, it is better to lock in the loss immediately and wait for new entry points, filtering false trading signals.
Investment advice. When it comes to profitable trades, you can never have too many trading signals. One technical indicator must confirm the other signals. Try to filter false signals with other technical analysis tools that generate signals, price action, trend lines. Don’t use just True Strength Index (TSI) alone. Use trend lines on the price chart as signal lines. It makes price movements much more predictable in any financial markets. To know exactly which one – a buy signal or a sell signal – is coming.
Why you should use the True Strength Index?
There are several benefits of using the True Strength Index. Some of these are:
- Relatively easy-to-use indicator;
- Useful indicator when finding overbought and oversold levels;
- An important indicator that shows you when a reversal is about to happen;
- It is great to complement other technical indicators like the Relative Strength Index (RSI) and the Moving Average Convergence Divergence.
Final thoughts
As you might have guessed based on all of the above, the True Strength Index is better to use in swing trading strategies.
Swing traders select instruments for trading based on various factors – fundamental, news, and technical analysis.
Pay the main attention to the technical analysis, market bias, and price action.
There are various tools and strategies which you can use in swing trading. But at the heart of any strategy is the theory of market cycles. The essence of this approach is the understanding that market movements are not straightforward, but cyclical in nature. Is the crypto-asset currently trending or it is in the flat between the two certain levels?
Сrypto asset moves in line with supply and demand. The balance between buyers and sellers causes the price to get stuck in a flat – in a certain range. From this point, any imbalance between buyers and sellers will cause the price to move out of its comfort zone and break one of the levels up or down. The main thing is not to get confused and to enter a trade at the right time on potential turning points. To do this you must have a well-developed trading strategy.
Learn how to go from seeing things through an indicator to seeing things through combined analytics tools – it’s like going from seeing things in black and white to seeing things in color. Price won’t be too unpredictable.
But don’t rush to react to every trade signal, if you wait for better trade signals, it will lead to more successful trading. Yes, it sounds so obvious that most people don’t even think about this simple idea. But you should.
The True Strength Index is one of the easiest indicators to use. But only practice makes it perfect. It is very important to find a way to balance risk and reward in the right way.