Traders are usually quite good at finding logical market entry levels. However, some of them hesitate when you ask them the question of when and where to enter or exit bitcoin this week.
The reason for this is the lack of fundamentals and an unreliable trading system.
For example, if you only use moving average crosses or trendline analysis, you may exit too early when a move makes quick reversals or too late at the end of a new move.
A good technical alternative would be the Parabolic SAR Strategy with Time System, which takes its name from the shape of the pattern, which resembles a parabola or French curve, as described by Welles Wilder in his book New Concepts in Technical Trading Systems. In this book, published in 1978, he introduced the parabolic system and several other methods that are now the mainstay of technical analysis.
Today we will talk about the Parabolic SAR (PSAR) indicator: we will analyze its algorithm and trading strategies.
The purpose of this guide is to provide you with the necessary knowledge on how to set up and effectively use the Parabolic SAR strategy.
Article contents:
- Parabolic SAR indicator
- PSAR formula
- Parabolic SAR indicator Settings
- How do you use parabolic SAR effectively?
- Rules for Entry
- Rules for Exit
- Parabolic SAR with other indicators
- How to access Parabolic SAR on FYBIT?
- Conclusion
Parabolic SAR indicator
The Parabolic SAR (Stop And Reverse) or PSAR is a technical indicator developed by J. Welles Wilder Jr, the inventor of the Relative Strength Index (RSI) and the Directional Movement index (DMI).
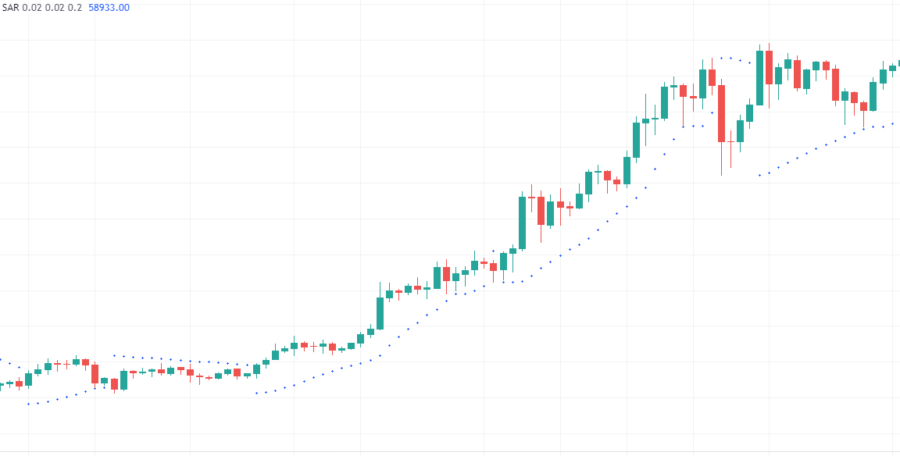
The Parabolic SAR is a trend following indicator. It’s a line of dots that is very similar to a parabola. It’s arranged on the price chart and its place depends on the relative position of the parabola and the price movement. Based on their positions there are drawn appropriate conclusions about the market’s state and the prospects for its development.
As we mentioned, PSAR indicator is called a parabolic stop and reverse indicator. Parabolic SAR places dots as moving stops of the price for buy and sell signals. Parabolic gives proper signals for placing stop orders, so this indicator is often used as a trailing stop.
When the price bars cross PSAR, its reversal system triggers. The indicator reverses and its next dot flips over to another side of the price movement. The extreme point of the previous movement becomes the reversal point. A reversal of the indicator is a signal of subsequent correction, flat zone, or subsequent reversal.
J. Welles Wilder recommended before starting to trade with PSAR, firstly identify the overall trend direction. If it’s a bullish trend, you should buy when PSAR falls below the price bars. If it’s a bearish trend, you should sell when PSAR rises above the price bar.
PSAR formula
The Parabolic SAR uses the acceleration factor (AF) in combination with the difference in the highest and lowest price to determine where the SAR indicator point is displayed.
The formula consists of two mathematical equations for upside and downside conditions.
Downside SAR = Previous SAR – Previous AF (Previous SAR – Previous LP)
Upside SAR = Previous SAR + Previous AF (Previous HP – Previous SAR)
AF stands for the acceleration factor. It determines how sensitive the Parabolic SAR is to trending markets. The default value of AF is 0.02 and its increment increases by 0.02 with a new high in the current trend.
HP represents a high point, which is the highest point in the bullish trend. Similarly, LP represents the lowest point of the bearish downtrend.
Parabolic SAR indicator Settings
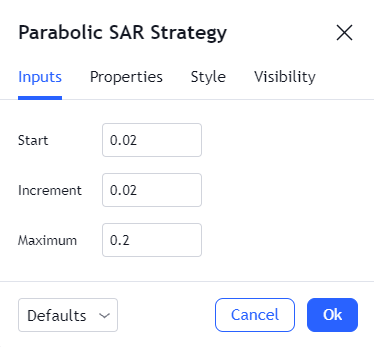
As you see from picture #1, there are only three settings for the indicator: Start, acceleration factor, and Maximum Acceleration. By default, values of “Start” and “Increment” are 0.02, “Maximum” is 0.2.
Increasing increment means that PSAR will follow the price movements more closely, leaving less space between the indicator and the price. This means that you will see an increased frequency of trading signals and more reversals on the chart.
Decreasing values mean that the PSAR will move slower and leave more space between the price and the indicator. This means that you will see fewer reversals.
Maximum Acceleration works the same way but to a much lesser degree. This value limits how fast the PSAR can accelerate during sharp price action. Changes in this setting will have less impact than changing “Increment”.
Active traders, especially those who have short term trading strategy and want to get in and out of positions quickly may opt for higher “increment”, which means high sensibility to any correction of the price movement. Longer-term traders who want to hold their positions can lower this value. As a result, the price will have to make larger moves to cause a reversal, and thus the frequency of reversals or corrections will be less.
There is no need for significant adjustments to the settings – in most cases, traders recommend using the default configurations.
How do you use parabolic SAR effectively?
Parabolic SAR trading strategies are effective, but because of their simplicity, beginners often use them incorrectly. Here we share some tips:
- PSAR shows general trends well, especially on large timeframes – no less than 1H.
- The tool works well only in conjunction with other indicators.
- Parabolic works well only in trending markets. Practice shows that flat periods bring a lot of false signals.
- Most commonly, this indicator is used as a trailing stop, while the current value of SAR only applies to the current bar.
Losers used to hold losing positions in hopes of a trend reversal. Parabolic protects the trader from his own indecision and subjects him to iron discipline. He places an exit order simultaneously with the opening of a position and moves the stop in the direction of the trend.
If you are heading for a rise or a fall and prices remain constant, the parabolic signal tells you that the time to enter is not right. You should not buy or sell unless you were sure that prices would rise or fall almost immediately after the trade. The parabolic signal prevents you from following a trend that is going nowhere.
During a monotonic trend, the parabolic SAR trading strategy is extremely useful. When prices are rising or falling without resets, it is very difficult to get the stops right on conventional charts and indicators. In these conditions, the parabola is the best tool for choosing a stop level.
Defining a trend
Everything is very simple:
- The parabolic SAR lies above the price curve – we observe a downward trend;
- The parabolic SAR is below the price curve – we are looking at an uptrend.
Rules for Entry
Many traders enter a trade immediately after the SAR dots flip to another side. Experts recommend waiting until the trend is confirmed by at least three or four dots. There is always a possibility that it is not a reversal but a corrective move. In this case, the old trend continues, and the trader’s buy signal is based on a false signal.
When a new trend forms, its strength can be determined by the distance between the points. It is not recommended to enter the market if the trend has been in place for a long time. The probability of a new reversal or correction is constantly increasing, so there is a high risk to go against the stream.
Rules for Exit
The best exit signal is at the moment when Parabolic SAR is very close to the price chart.
Since the signal of the indicator is given with a delay, you should not wait for the final transition. This may cause you to lose a significant part of your profit.
However, if the asset stays in sideways markets, there is no need to rush, even if the indicator gives clear signals. Most of these signals are false, so you cannot act on them until you are convinced that it’s the correct trend’s direction. To identify a stable trend, you can use, for example, Bollinger Bands or Moving Averages.
Parabolic SAR with other indicators
Parabolic SAR & Bollinger Bands
A very simple trading system that allows you to determine entry points into the strong trend. The goal of this strategy is to stay in the clear trend as long as possible. Double confirmation provides us with additional accuracy.
Buy signal: Combining buy signals from two indicators – piercing the SMA (middle line) of the Bollinger Bands through the price bars upward/ downward & Parabolic SAR dots are below/above the price.
Sell signal: Sell confirmation of one indicator. BB simple moving averages line cross or PSAR changes its position.
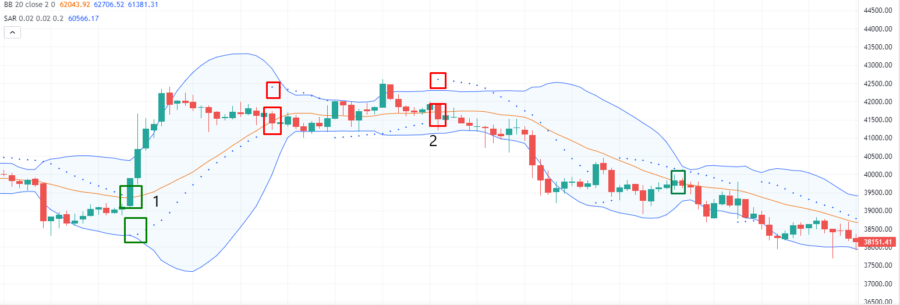
In picture #3 we see how Parabolic SAR works in conjunction with Bollinger Bands. Double buy confirmations from both technical indicators signal us to open long trade. The exit signal for this trade is the crossing of the BB middle line with the price.
In the next example, we see how this strategy also applies to the opposite direction.
Parabolic SAR & MACD
In this strategy, we combine PSAR and MACD signals.
Buy signal: Double confirmation from both indicators. The MACD is about to break through the zero level from the bottom up for long positions and from the top down for short positions. The Parabolic SAR strategy is below the price for long positions / above the price for short positions.
Sell signal: Sell confirmation of one indicator.
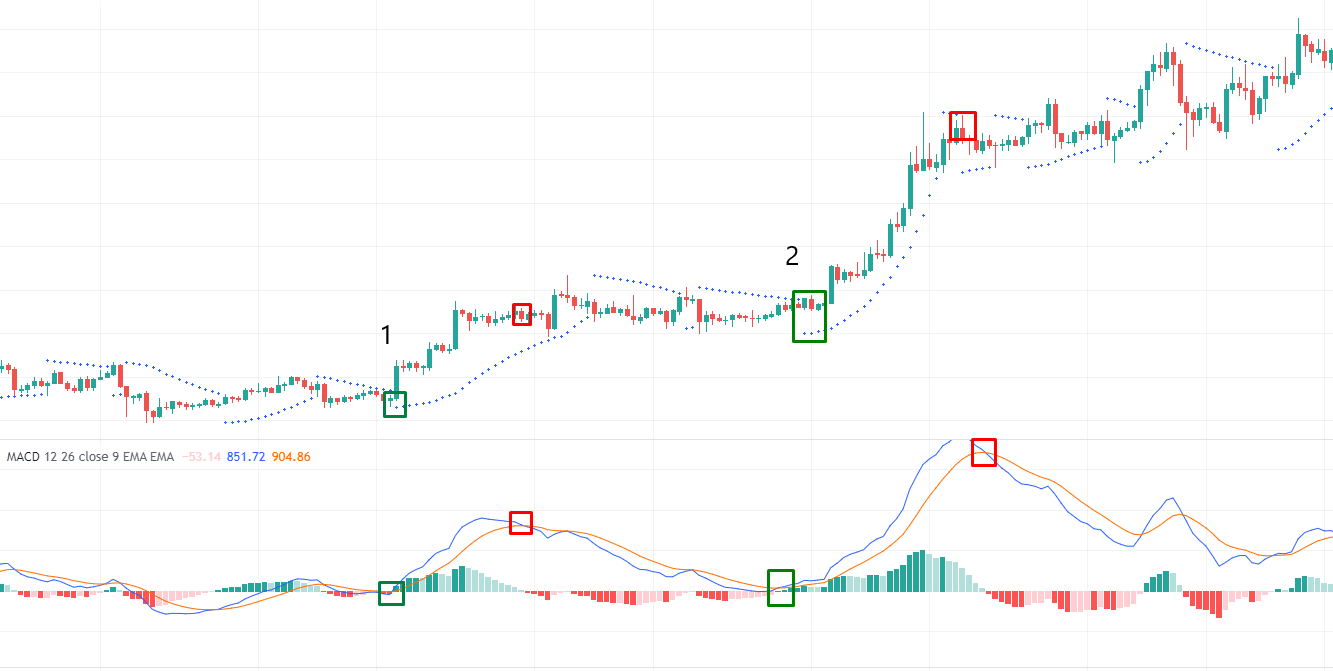
You should keep in mind that there can be many signals, but not all of them are 100% accurate. This is the reason why we use double confirmation in these strategies.
Parabolic SAR is a trend indicator that shows all price fluctuations. Therefore, it is best to focus on the moments when the price reaches steep highs. This is the time when a trend reversal is most likely to occur. The necessary confirmation is provided by the MACD (a break of the zero line in the right direction indicates a suitable moment).
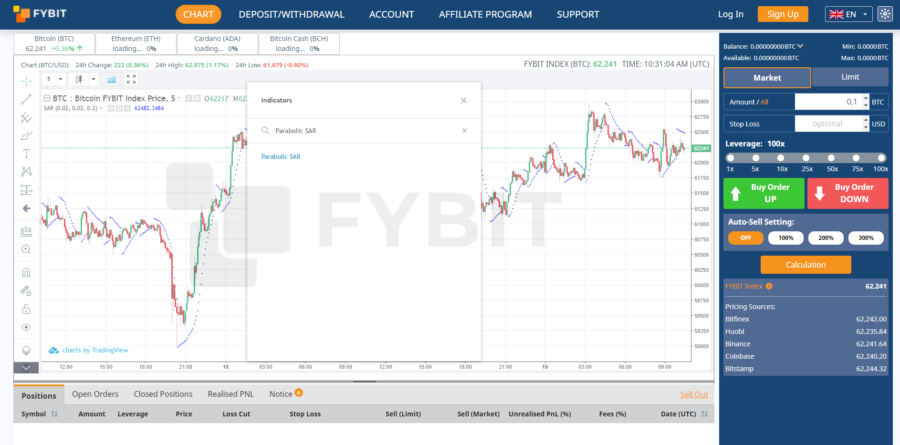
How to access Parabolic SAR on FYBIT?
In order to access the Parabolic SAR go to our main page and open the chart. Click the “Indicators” tab and enter “RVI” or “Relative Vigor Index”.
Most trading platforms usually have the same issues – lagging platforms or bots in the support team.
FYBIT is the platform where you will forget about these issues and will be satisfied by trading itself.
We recommend you our trading platform and hope you will enjoy it.
Conclusion
Parabolic SAR is not the simplest instrument when it comes to calculating its construction, but the advantages and disadvantages of this indicator become clear after a small test in the context of several trading strategies.
The biggest disadvantage of Parabolic is that it is practically useless and even unprofitable when used alone. A large number of false signals, as well as a periodic delay, will wipe out the profits you make with correct trades. Parabolic SAR needs additional tools – in combination with them it becomes really effective.
One of the advantages is the versatility of the PSAR. The Parabolic can function as both a main and an additional instrument. In addition, the indicator can be used both to find entry points into the market and to determine when to exit a trade.
Considering these features of Parabolic SAR, the best option for a trader is to look for an effective system based on complex analysis. However, even the most seemingly effective system must first be tested on a demo account.
Trading in the financial markets carries a high level of capital risk. To reduce the risks, you should strictly follow the rules of money management and always set a stop loss. All decisions a trader makes in crypto trading are his personal responsibility.