Ichimoku Kinko Hyo or Ichimoku Cloud is one of the unusual technical indicators from Japan. This analysis was a real hype there in the 1970-80s. The author Goichi Hosoda had spent 30 years perfecting this technique.
It is also known to foreign traders as “Ichimoku” even it is used throughout the world as a purely Japanese domestic technical index along with the “Candlestick Chart”. It is a very deep technical analysis indicator that provides precise trading signals.
The first reaction of traders I know is: “What is this monster?”, “Why is this so complicated?” or “I can not see the price action because of this indicator”.
Yes and yes. It may seem difficult because it has more components than other technical indicators, but it is a very simple method of technical analysis when you get right down to it.
The most important questions should be “Is Ichimoku a good indicator?” or “Why is it supported by many investors around the world?”. This article will give you the answers. We will explain the basics of Ichimoku Cloud in detail and show you how to use it. We will start from the basics and finish with complex strategies for predicting the trend direction.
Article contents:
- Ichimoku cloud indicator
- Five lines that make up Ichimoku Cloud
- The setting of Ichimoku indicator
- How to use Ichimoku Cloud Indicator?
- Trading strategies with other indicators
- How to access Ichimoku cloud indicator on FYBIT?
- Conclusion
Ichimoku cloud indicator
Ichimoku Kinko Hyo is a chart analysis method invented in 1936 by Goichi Hosoda. The inventor, Mr. Hosoda had founded his own research institute and worked for seven years with 2000 employees to complete Ichimoku Cloud.
Ichimoku chart, which is based on detailed data, is an index that was originally developed based on stock prices but can also be applied to the cryptocurrency market.
The big difference between the Ichimoku Cloud and other technical tools is that many indicators focus on price changes and market movements and treat time as secondary, whereas the Ichimoku Cloud system puts timing above all. The point is that price is treated as secondary.
In other words, it is a technical index that specializes in analyzing “when” rather than “how much”. Moreover, the Ichimoku Cloud is based on the idea that the price action moves in the direction where the balance between buyers and sellers is lost. Moreover, it provides you with support/ resistance levels, also helps to determine good enter/ exit points.
Five lines that make up the Ichimoku Cloud
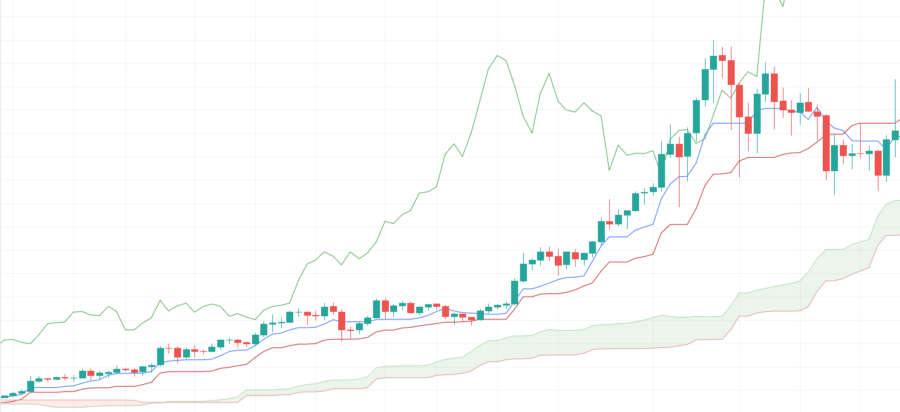
The Ichimoku Kinko Hyo consists of five lines: a conversion line, a base line, two leading spans, and a lagging span.
We will not go into the formulas of these lines in this article. We are interested in what these lines show us on the chart. You can use these lines in your trading strategy once you learn to read them. Let us first look at the meaning of each line.
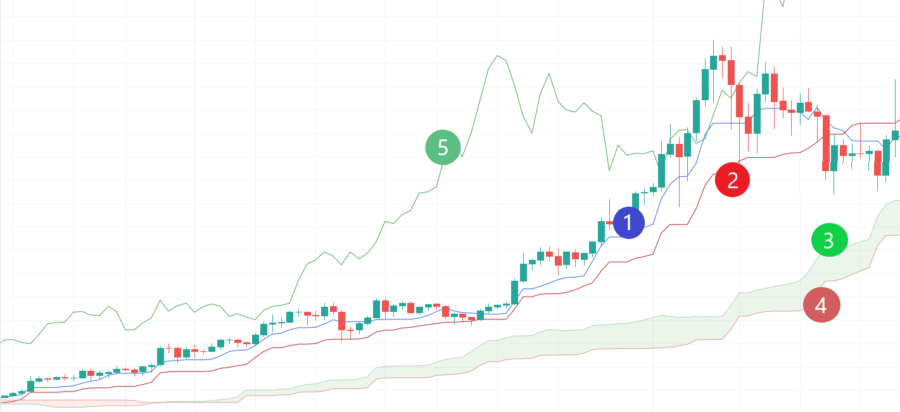
1. The Conversion Line (Tenkan-Sen)
The conversion line combines the average of the highest and lowest prices over the last 9 days, indicating the short-term direction of the market. The default value is 9 bars. It’s a blue line by default.
The 9-days conversion line practically repeats the simple moving average (SMA) with the same period, but it’s not so much smoothed. The feature of the Tenkan-Sen is that it indicates the presence or absence of a pronounced trend. If the price moves to the flat zone, then the indicator is flat too.
However, when the price is moving, the conversion line shows the price movement over the last 9 days. Also, it shows support/ resistance levels as well as trend direction. This makes the line more versatile than the simple moving average.
2. The Base Line (Kijun-Sen)
The base line shows the average of the highest and lowest prices of the past 26 days and indicates the medium-term direction of the market. The default value is 26 bars. It’s a red line by default.
3. Leading Span A (Senkou Span A)
The leading span is the combination of two lines – leading span A & leading span B. It represents the impact of the current price movement on the future.
Leading Span A or senkou span A shows the average of the base line and the conversion line 26 days ahead. It represents the faster cloud edges.
4. Leading Span B (Senkou Span B)
The leading Span B line or senkou span B shows the average of the highest and lowest prices over the last 52 days ahead. It represents the slower cloud edges.
5. Lagging Span (Chikou Span)
The lagging span or chikou span is considered the most important factor in Ichimoku indicator. It shows the closing price of the day with a lag of 26 days before each day. In other words, we compare the price action of the current day with the price of 26 days ago. It’s a green line by default.
The Cloud
This cloud itself is the pinnacle of Ichimoku Cloud strategy. The cloud is a balance between support and resistance that takes into account the price action of the previous periods. The longer the period, the more precise buy/ sell signals tend to be.
Cloud is created by filling in the space between the leading span B & leading span A. It takes the beginning from a band-shaped pattern. The “cloud” in the Ichimoku indicator is a point that is very noticeable in future market forecasts. The cloud has two states – green cloud and red cloud, indicating an upward or downward trend, respectively. Ichimoku Cloud is one of the leading indicators.
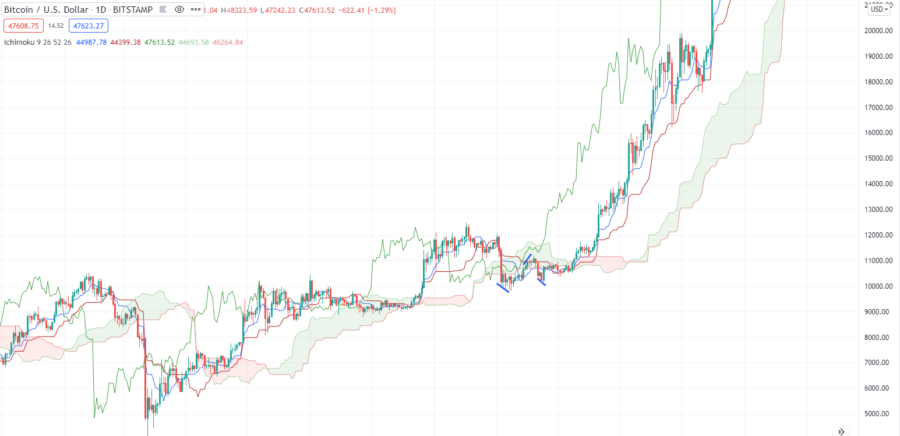
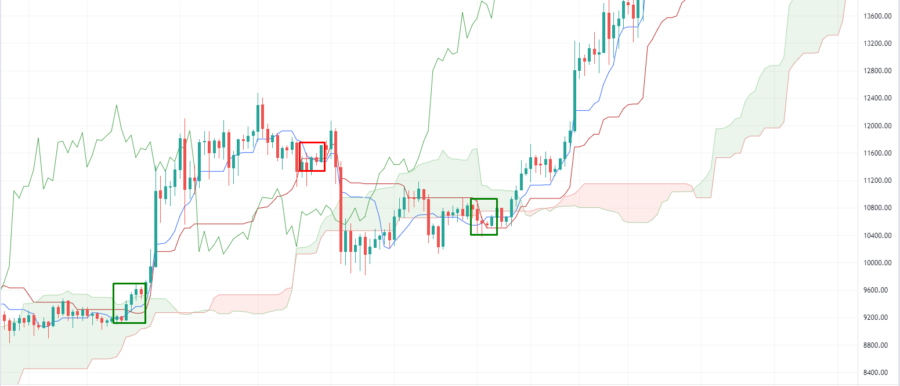
Traders who trade with Ichimoku indicator avoid trades when the price fluctuates within the cloud. Note that when the candles were in the cloud, Bitcoin was in a not clear trend. But once the price moved beyond Ichimoku Clouds, a strong trend formed – that’s how the Ichimoku Cloud works.
The setting of Ichimoku indicator
The Ichimoku technical indicator can be customized to meet the needs of the investor or trader using it. We are going to consider the most common configurations.
Traditional Ichimoku Cloud
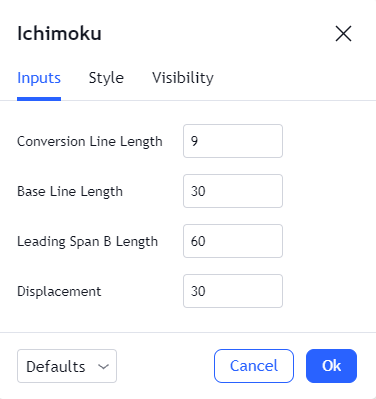
The traditional version is the original configuration. It sets the main variables as follows:
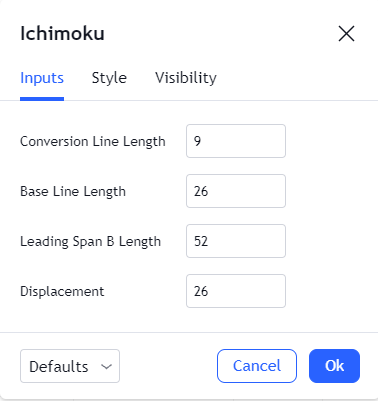
Note, at the time the Ichimoku Cloud was designed, the average employee in Japan worked 46 hours per week in a six-day week. Thus, the default configuration of Ichimoku Cloud is designed for a six-day week.
Ichimoku Cloud’s options for trading in the trend ( Option A)
Traders tend to use the following Ichimoku Cloud settings when trading trending markets with particularly high volatility:
Since the base line, leading span B line, and leading span period have higher values than the traditional configuration, the averages used in plotting the Ichimoku Cloud with this configuration represent more historical data and provide better trade signals. Finally, long-term predictions have a much higher probability of coming true than short-term predictions.
Option B
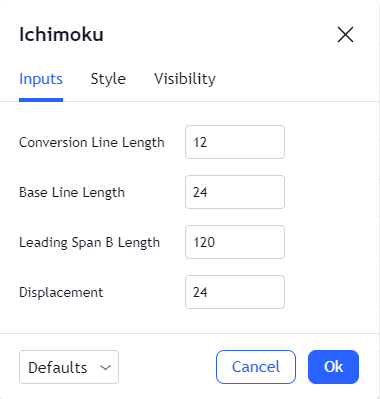
In this alternative, all numbers in the configuration have higher values than in the traditional configuration and end up representing much more data points. Although this configuration is not quite sensitive to volatility, this Ichimoku Cloud configuration is another compelling option for those who looking for a long-term trading strategy.
How to use the Ichimoku Cloud Indicator?
Conversion & Base lines
First of all, Ichimoku traders should pay attention to the direction of the base line and its crossovers with the conversion line. The direction of the base line indicates the trend direction. It is considered an uptrend when it is up and a downtrend when it is down.
If the base line is up and the candlesticks are above it, this means that the uptrend is strong, and vice versa if the base line is down and the candles are below the base line. In the case, it means that the downtrend is strong.
When you look at a combination of a base line and a conversion line, there are many cases where their crossovers are designated as buy or sell signals. The intersection of the conversion line and the base line serves as a guide for market reversal, and the following two types are typical.
・ The conversion line crosses base line from below: buy signal (golden cross).
・ The reversal line breaks below the reference line: sell signal (dead cross).
It is used in the same way as the moving average lines. The conversion and base lines signals serve as short-term and long-term lines, respectively.
Leading Span
When performing a leading span analysis, pay attention to the positional relationship between the candles and the “cloud” that fills the space between senkou span A and senkou span B.
If the candles are above the cloud, it indicates a bullish trend. When bars are below the cloud, it indicates a bearish trend. The combination of clouds and candlesticks can also be used as Ichimoku signals.
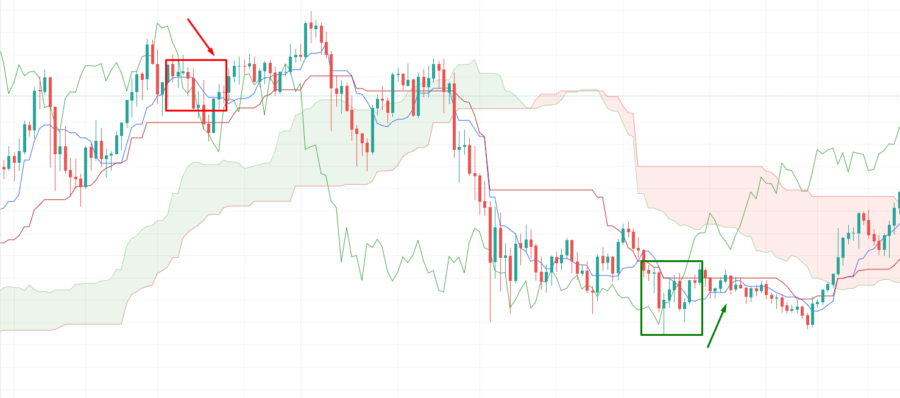
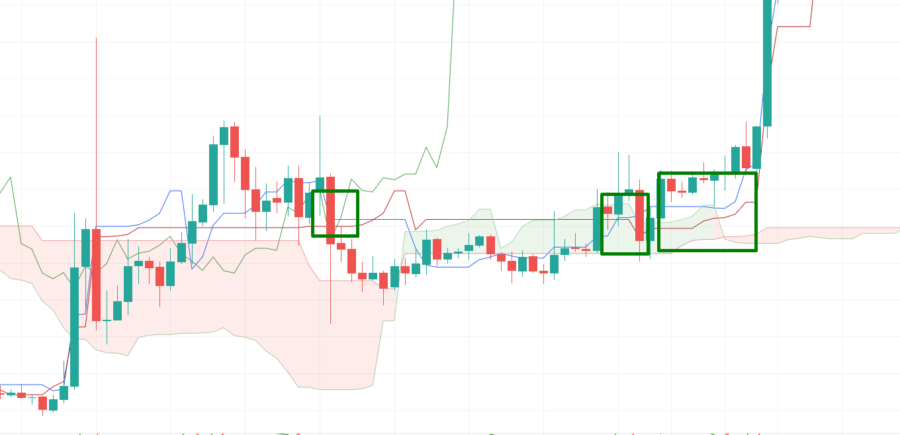
・ Candlestick breaks above the cloud: Bullish signal.
・ Candlestick breaks below the cloud: Bearish signal.
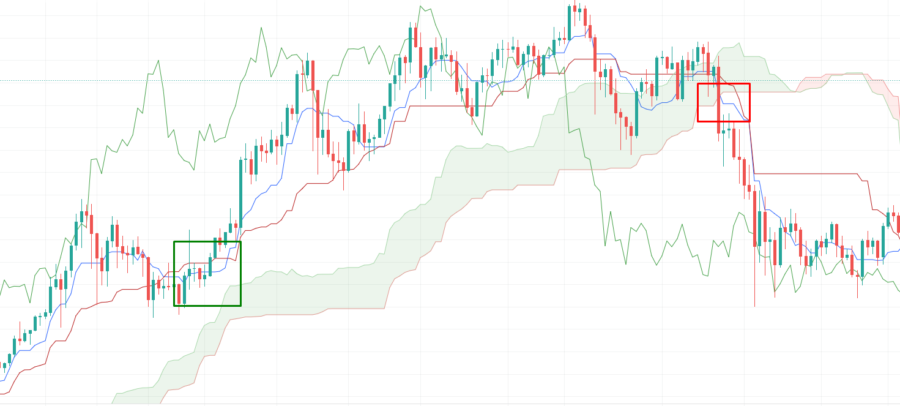
So when the candlestick breaks into the cloud, attention turns to whether it breaks out above or below the cloud. In this case, the cloud tends to become a strong support and resistance level. Upper resistance line (resistance level) or lower support line (support level), and when it breaks it, the market can gain momentum, such as a sudden rise or fall. Therefore, when candlesticks move above or below the clouds, it is common to open the position.
Lagging Span
The lagging line (chikou span) can also be used as a trading signal in relation to the candles.
・ Lagging span surpasses candlestick from below: bullish signal to buy.
・ Lagging span breaks out of candlestick from above: bearish signal to sell.
Catch trend reversals with Ichimoku indicators
A bullish three-step reversal is a situation in which the following three buy signals are in place.
- Golden cross of conversion line and base line
- The lagging span surpasses price action
- Candlesticks surpass clouds
When these conditions occur at the same time, it will be a very strong buy signal, and it is expected that the bull market will proceed. Also, when the opposite conditions are met, it is called a bearish three-step reversal, and it becomes a strong selling signal.
However, there are cases where you cannot wait for all three signals. So you can make the exceptions and enter when two of the three conditions are met. In this case, you must be careful not to fall into a bull or bear trap.
Trading strategies with other indicators
The Ichimoku Kinko Hyo is a time-based technical analysis. It is a very powerful tool for interpreting trends and trading signals. By combining it with other technical indicators that focus on price, Ichimoku Cloud indicator will become a more efficient and advanced analysis.
Of course, every technical analysis and its indicators vary by method, but many investors trade by combining moving averages, RSI, Bollinger Bands, MACD, and so on.
How to access Ichimoku cloud indicator on FYBIT?
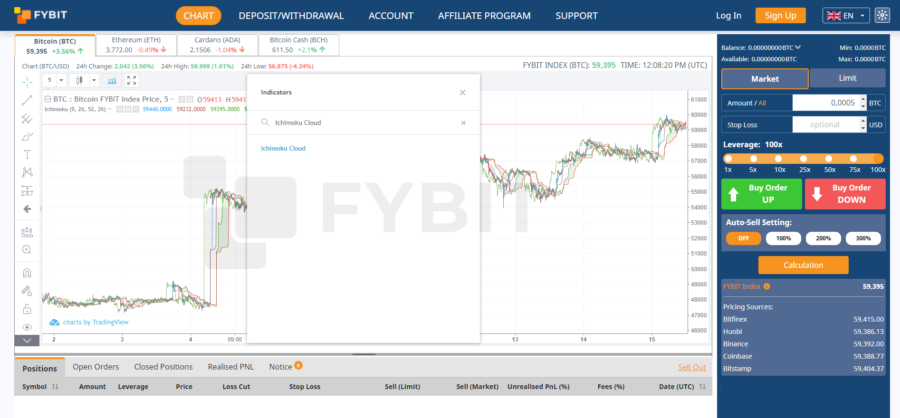
In order to use Ichimoku Cloud on FYBIT go to our chart.
Click the “Indicators” tab and enter “Ichimoku Cloud”.
Most trading platforms usually have the same issues – lagging platforms or bots in the support team. FYBIT is the platform where you will forget about these issues and will be satisfied by trading itself. We recommend you our trading platform and hope you will enjoy it.
Conclusion
In this article, we have discussed awesome indicator. Explained the meaning of all the lines in it. Observed all bullish & bearish signals and learned how to find future support and resistance.
Definitely, in the beginning, Ichimoku may seem difficult. Firstly, just place it on your technical chart. Follow our guide and use the simplest points one by one, look at whether the “clouds” are thick and where the candlesticks are above the “clouds”. As you look at it daily, you may become more familiar with it, discover its appeal, and see why the Ichimoku Kinko Hyo is timeless and popular around the world.
We hope this tool will help you maximize profits. Check Ichimoku Clouds and trade with profit, good luck.