Any trade provides us only two pieces of information: price and volume. Unfortunately, sometimes even professional traders underestimate volume and volume-based indicators.
The best investment advice that a trader can get is to add volume indicators to his technical analysis.
Ok, we got this. We open the TradingView chart and track the volume of any asset. We see big, small bars which are not connected with price movements, picking random volume indicators and checking them. And what’s next? The mix of these thoughtless actions without fundamental comprehension of volume and its tools couldn’t get us to our investment objectives.
This article is your solution. We’ll give you an understanding of the volume and will teach you how to use the volume oscillator.
Possessing this knowledge and using it in practice would be a huge advantage for you. This article breaks down the essential thoughts about volume analysis. Besides, it gives you the instruments you need to read price charts and volumes so you can upgrade your trading strategy.
Article contents:
- Definition
- Formula
- How to use Volume Oscillator?
- VO is not a standalone indicator
- How to access VO on FYBIT?
- Summary
Definition
Volume analysis
The volume describes the quantity of a particular asset, which is exchanged among sellers and buyers. When volume is high, more market participants have changed possession of this asset. When it is low, fewer market participants have changed hands.
Benjamin Graham, a mentor of Warren Buffett and the father of value investing called the market a “voting machine.” If so, then the volume is the ballot box. Volume is a literal illustration of the capacity behind the forces of supply & demand.
Volume confirms the direction of current price trend. It could be the source of liquidity, the substantiation of information, the fulfillment of beliefs, or the disclosure of dissenting opinions. The most populist comparison says that volume is the fuel of the market.
Volume Oscillator indicator
The Volume Oscillator is one of the volume oscillators that measures the ratio between two moving averages of volume. In other words, this volume oscillator displays the difference between fast-moving average and slow-moving average of volume.
The fast-moving average of the volume usually covers a period of 5 bars. The slow VMA usually covers 10bars. Traders regularly argue about the applicability of different periods: (14:28) is a conservative option; (5:10) – default settings on TraidingView; enthusiasts prefer to use the range – (5:20).
In this article, we are going to use (5:20) (picture #1). The VO oscillates up and down a zero line. The rising volume or declining volume in this histogram can be interpreted as the strength or weakness of price trends.
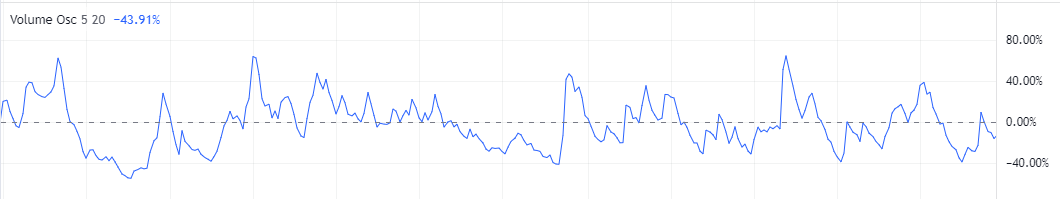
Positive values indicate that the market provides enough support to keep the price direction stable in the current trend. Negative values indicate a fail of support, which means that the price chart is heading for a flat zone or we will see a reversal of the asset.
The Volume Oscillator (VO) has technical significance in identifying periods of decreasing or increasing volume.
Formula
First of all, you need to keep in mind that Volume Oscillator is based on two Moving Averages of Volume or VMAs. Note that we use volume moving averages (VMAs), not moving averages (MAs). VO just displays the difference between these two moving averages of volume – the fast one & the slow one.
This calculation is not one of these exotic mathematical formulas, it is easy to remember and grasp:
Percentage Volume Oscillator = [(Fast VMА – Slow VMА) / Slow VMА] * 100.
In order to check volume activity, let’s set Volume Oscillator parameters – (5: 20). Where the fast volume moving average displays the history of last 5 bars and the slow-moving average shows the history of last 20 bars.
Slow Volume Moving Average & Fast Volume Moving Average
As we mentioned before, the Volume Oscillator just computes the difference between two VMAs. Thereby in your chart, you can see the volume oscillation and possible abnormal volume activity that helps a lot in analyzing volume.
The VO shows us how the current market sentiments as the shorter-term volume related to the average volume for a long period.
If we take our previous parameters of Volume Oscillator (5:20) – it means that if the percentage volume oscillator is above zero line, the fast volume is above the slow volume moving average. Based on this we can enclose there is an unusual increasing volume according to the parameters we have set.
How to use Volume Oscillator in the Cryptocurrency Market?
Trend
Let’s discuss what is the trend and how to recognize it on crypto market.
An uptrend is just a support line that goes up over time. It represents the state of asset when demand is greater than its supply.
Accordingly, we could say about a downtrend. It is simply a resistance line that falls down over time. A downtrend means that demand is being overwhelmed by supply. Every time the price goes up, more sellers are eager to get out of a position and buyers don’t have enough demand at this price level to resist their pressure. That triggers sellers to sell their coins at a lower price than they have expected. In addition, it prevents declining prices.
Volume information is useful primarily because it can alert you to unusual buying or selling activity. Price tends to move from periods of low volume to periods of high volume. And the same backward.
This Volume Oscillator can help us measure volume and indicate market sentiment. Especially readable timeframes for oscillator the volume are month/ week charts.
The VO increases in a rallying market. It leads the overall volume trend up and up until the asset is overbought. In an overbought state, the volume indicator will reverse direction. If the market is falling or moving to a flat zone, its values should decline.
Support and Resistance
Previously we have mentioned the idea that volume is the force that drives the market. We are interested in how is this force acting in support & resistance zones.
Resistance is an area in which sellers can resist pressure from buyers. When the price of an asset rises to a resistance zone, sellers believe that the asset is overvalued at that level. Through their selling activity, sellers force the stock back down. You can think of volume as the force required for resistance break.
Technical analysis tells us that support is a price level where buyers can resist sellers’ pressure. When buyers start to believe that the price of the asset is undervalued, they trying to change the trend direction by opening long positions. As the volume grows, we see more buying intensity in that zone, which moves the price of the asset back up.
This moment of the market is very important for us because it gives us the chance to gauge volume and predict subsequent support break, flat zone, or reversal.
Support/ Resistance zones can be found by looking at trend indicators or key lows/ highs where such massive buying have occurred in the past.
Support/ Resistance breaks have an interesting feature which is determined by growing volume oscillator’s values.
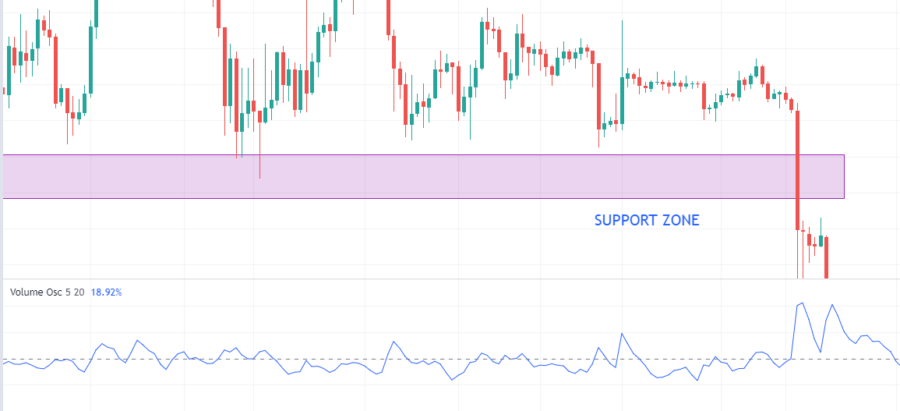
In picture #2 of BTC / USD daily chart, we see that VO values were growing by entering the support zone. Then the price has pierced this zone and has shown a significant rise of volume .
In other words, support and resistance breaks occur at a high volume. You should consider a break of support in conjunction with abnormal volume activity as panic selling. And break of resistance with an abnormal volume spike should be considered as greedy buying.
Here we come to the idea that using of Volume Oscillator as a standalone indicator is a bad decision. It’s just a volatility confirmation indicator. Otherwise, you will always be misled by this indicator, in flat zones.
Top reversal
To confirm a market turnaround, a technical analyst must determine whether the measurements of price and volume momentum agree with each other or not.
We have already mentioned in the “Trend” paragraph how price and volume momentum act in case of a soon reversal. I want just to remind, that volume expands in a rallying market. It leads volume momentum up and up until the asset is overbought.
When the asset is overbought, the volume indicator will reverse direction. The market direction will not change rapidly. First, it will slow down and then the market will enter the distribution area.
Trend reversal will go along with falling Volume Oscillator. Falling VO values will mirror the absence of long positions in the market and the end of past performance. In other words, demand is being overwhelmed by supply.
Subsequent falling VO and price movement will indicate the new prevailing trend.
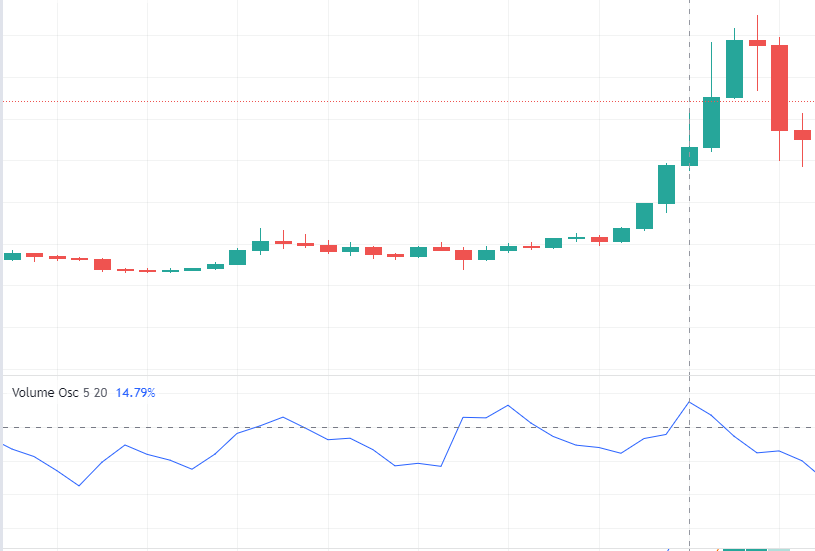
It’s a monthly BTC / USD chart. In the middle of the chart – price movement has broken its support zone, the volume indicator was rising too.
As you see in the chart the price trend does not change its direction even volume-based indicator did. One more time, when you see a rising price together with falling volume – it’s a bearish signal. It’s very important to pay attention to these trading signals, especially when you use weekly/monthly timeframes.
Bottom reversal
The bottom reversal has the opposite fundamentals. Here we wait until bears will lose their strength. Then bulls will try to take advantage and lead the market to increased demand. After a new dump with enormous values of volume oscillator, bears close their short potion and market start filling by new coming demand.
Here we are going to share main points to identify bottom reversal:
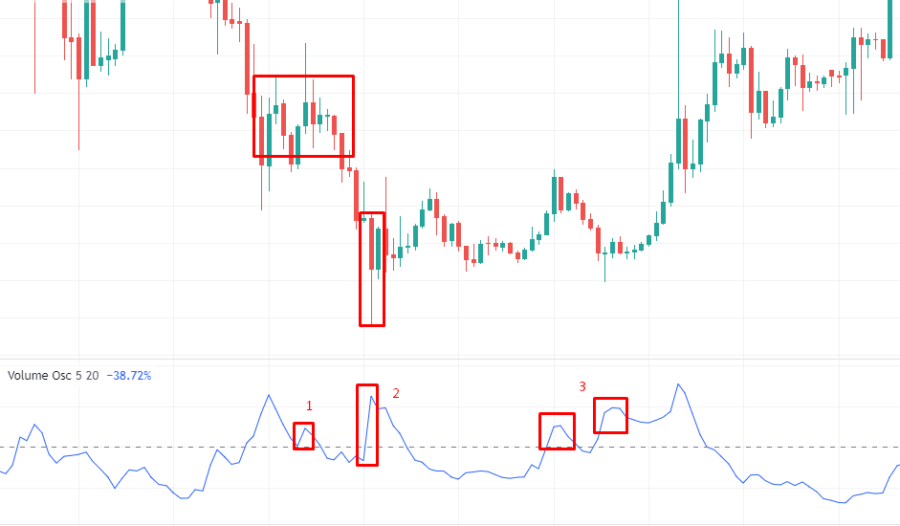
- Wait for a correction with a spike in the Volume Oscillator larger than the spike of the previous correction.
- The subsequent dump shows expanding volume. Normally this impulse goes with a large spike of volume.
- The subsequent rise of asset’s price hoes along with rising of Volume Oscillator too.
VO is not a standalone indicator
If you know the basis of VO, the indicator will become a very effective tool for confirming your trade signals. But it’s a bad idea to use volume oscillator as a standalone indicator.
You should never rely solely on volume-based or trend-based technical indicators. If you do, you will only see half of the whole picture and that will lead to more losses than gains. When you combine your trend indicators with an oscillator like the VO, you will be able to distinguish if the trend changes due to abnormal volume activity or not. It also helps a lot in analyzing potential trades.
How to access VO on FYBIT?
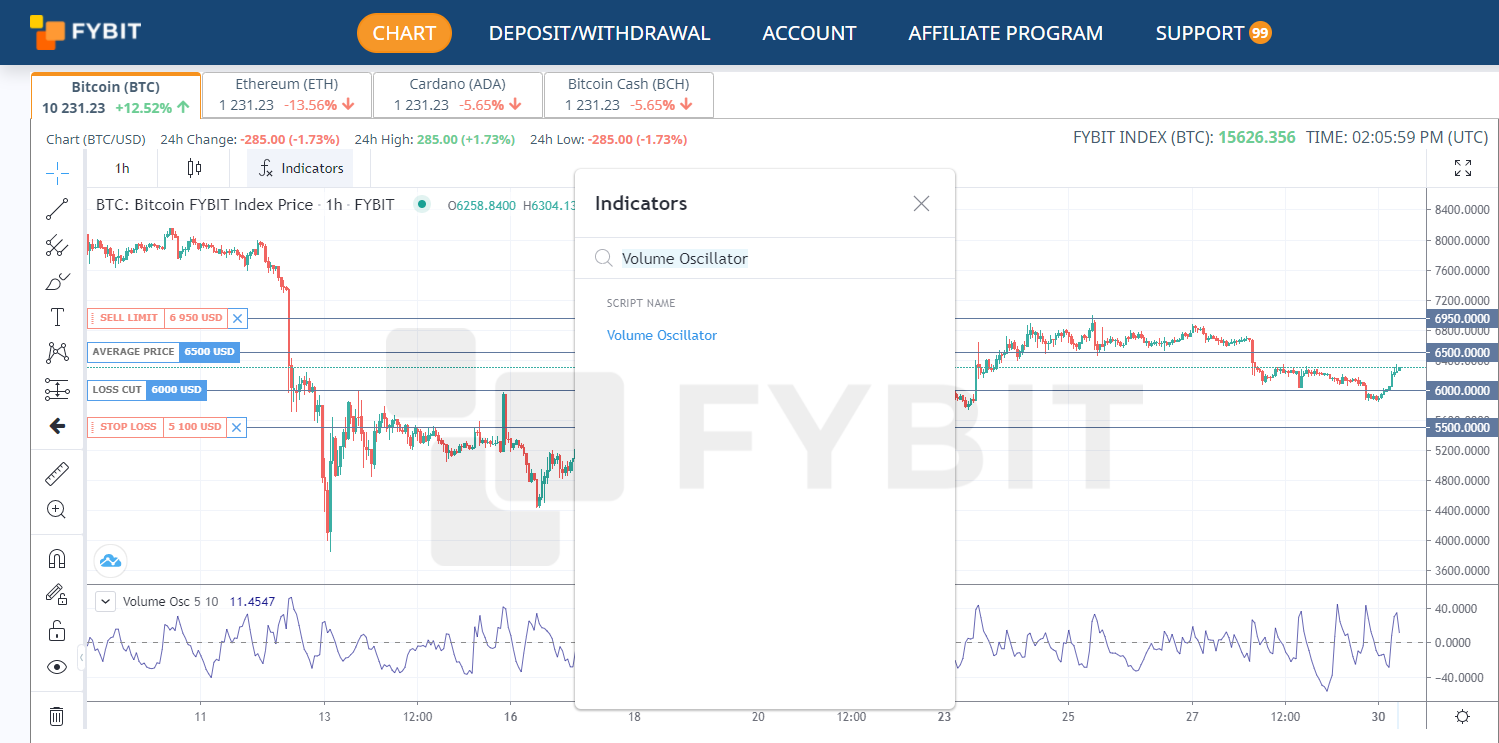
In order to access the Volume Oscillator (VO) go to our main page and open the chart that you use for trading.
Click the “Indicators” tab and enter “VO” or “Volume Oscillator”.
Most trading platforms usually have the same issues – lagging platforms or bots in the support team.
FYBIT is the platform where you will forget about these issues. We recommend you our trading platform and hope you will enjoy it.
Summary
For an engine to run, it needs fuel. The fuel of the market is provided by new supply (sellings) and demand (buyings). Volume is a measure of the total supply and demand which is produced by market participants.
If a swing trader or intraday trader is able to explain the expanding volume of your asset, it shows his competence. Proficiency in volume analysis is a rare and useful skill.
Volume Oscillator does not have more technical significance than other indicators. You can use classic volume bars if you want. We just hope that using any volume indicator will help you understand market mechanics deeply.
Hope this article helped you a lot. Check Volume Oscillator and trade with profit, good luck.