What you’ll discover in this article:
- What is the Chaikin Oscillator?
- How to calculate the Chaikin Oscillator?
- How to use Chaikin Oscillator?
- Advantages
- Disadvantages
- Best setting
- Trading strategy
- The bottom line
What is the Chaikin Oscillator?
The Chaikin Oscillator is essentially a momentum indicator that was developed in the 1970s by American trader Marc Chaikin (Also known for Chaikin Money Flow and Chaikin Analytics). It is used by technical analysts to identify an upcoming trend reversal in any financial markets.
The Chaikin Oscillator belongs to the unique hybrid custom indicators. Mark Chaikin was so inspired by the works of Joe Granville and Larry Williams, that he decided to create his own indicator. Chaikin Oscillator is based on moving averages, which are calculated using Accumulation/Distribution indicator data. This is the author’s vision of the market and his signals suitable for use by traders!
Chaikin Oscillator measures the momentum of the accumulation/distribution line using the MACD model. The oscillator must predict when the line will change direction.
How to calculate the Chaikin Oscillator?
The calculation of the indicator is defined as subtraction of 10-period exponential MA oscillator Accumulation/Distribution, from 3-period Accumulation/Distribution oscillator. By comparing the dynamics of price and volume, you can identify market bases and tops (medium-term/short-term).
It turns out that at the beginning we observe the growth of volume, after that (with lower volumes) the price fall, and only in case the market approaches the bottom some accumulation can take place.
In other words, the closer the closing price of a crypto asset to its maximum value, the more active accumulation takes place. In the opposite situation (closing of a crypto asset price below the average daily price value) – distribution takes place.
CO = MA (Nshort, AD) – MA (Nlong, AD),
where:
- MA (N, AD) – a moving average of AD over N periods,
- AD – the value of Accumulation Distribution Line indicator,
- Nshort – number of intervals in the short period,
- Nlong – number of intervals in the long period.
The Chaikin Oscillator is basically a Moving Average Convergence Divergence (MACD) applied to the Accumulation Distribution Line indicator.
This makes it an indicator of an indicator as it attempts to predict changes in the Accumulation Distribution Line indicator.
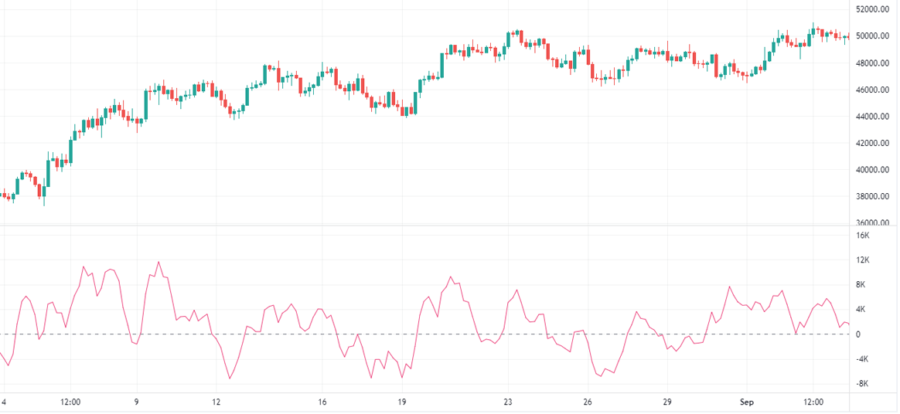
The ADL indicator is derived from an indicator known as the Close Location Value (CLV), which compares a cryptoasset’s high, low and closing price.
If the closing price is below the midpoint of the high-low range, the CLV will be negative; if it is above the midpoint, the CLV will be positive.
Here in the chart, you can see these positive and negative values:
How to use Chaikin Oscillator?
Chaikin Oscillator generates signals that belong to different types of signals. Below we will elaborate on each of them in more detail. You will learn how to identify trading signals based on this data.
Chaikin Oscillator divergence signals
There are two types of divergences, bullish and bearish divergences that show which of the two prevails, buying or selling pressure.
Divergence occurs when the price moves in one direction and the indicator moves in the other. This tells traders that the price of a crypto-asset has been weakening recently and they should expect a trend reversal. Divergence can be bullish or bearish.
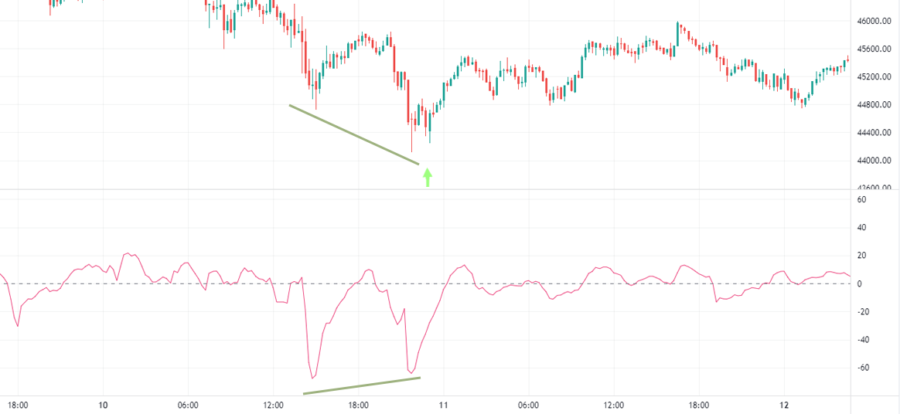
A bullish divergence is observed when the minimum price updates its values on the currency pair chart, and the minimum of the Chaikin Oscillator values is higher than the previous one. Thus, the trader observes a divergence between the Chaykin indicator values and the price, which, in the example of a bullish divergence. For day traders, this could mean short-term buying of the cryptocurrency pair.
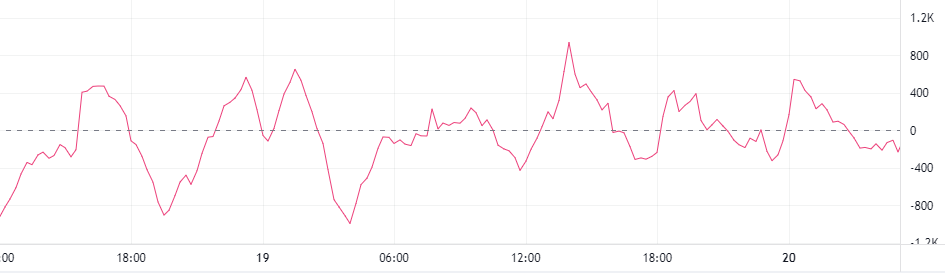
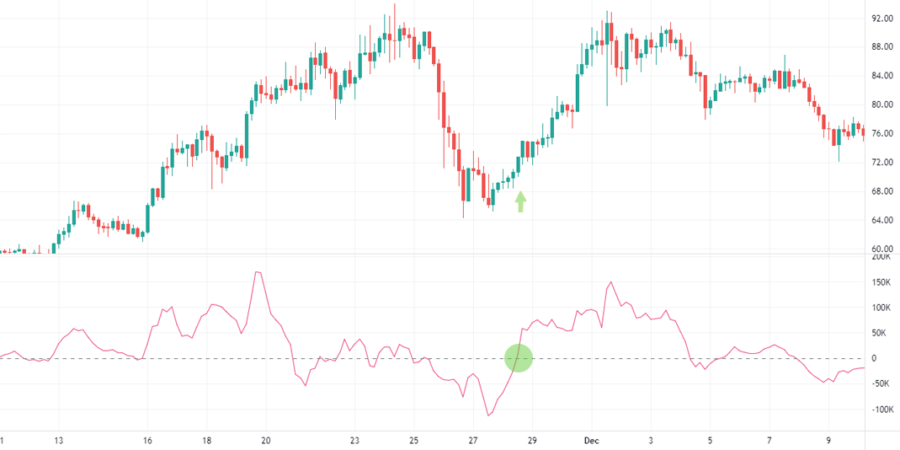
One the picture below there is a bullish divergence of the Chaikin indicator. That’s also known as positive divergence.
Here you can see the price moving in divergence with the indicator, indicating oversold. Time to buy!
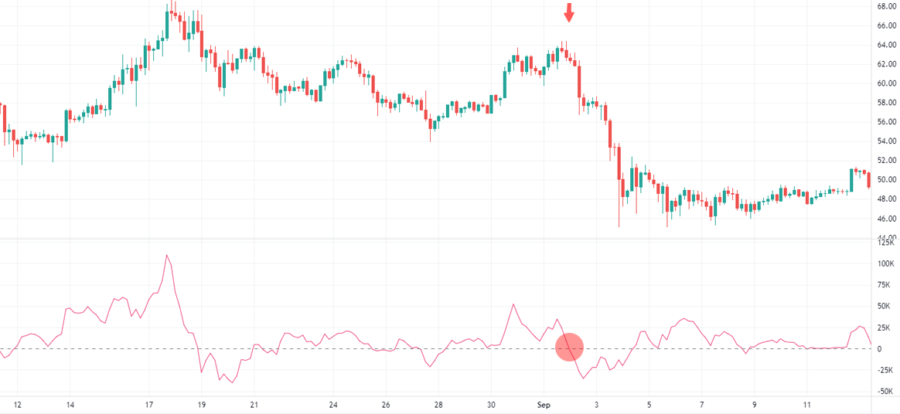
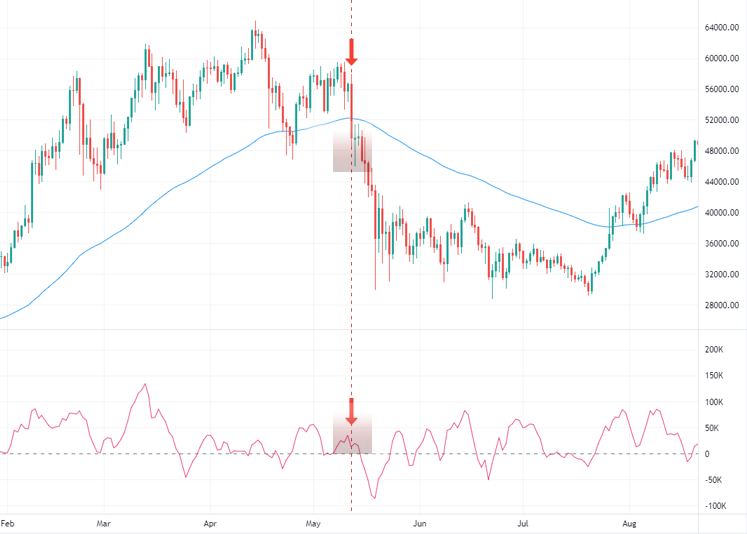
There is a bearish divergence which is also called negative divergence:
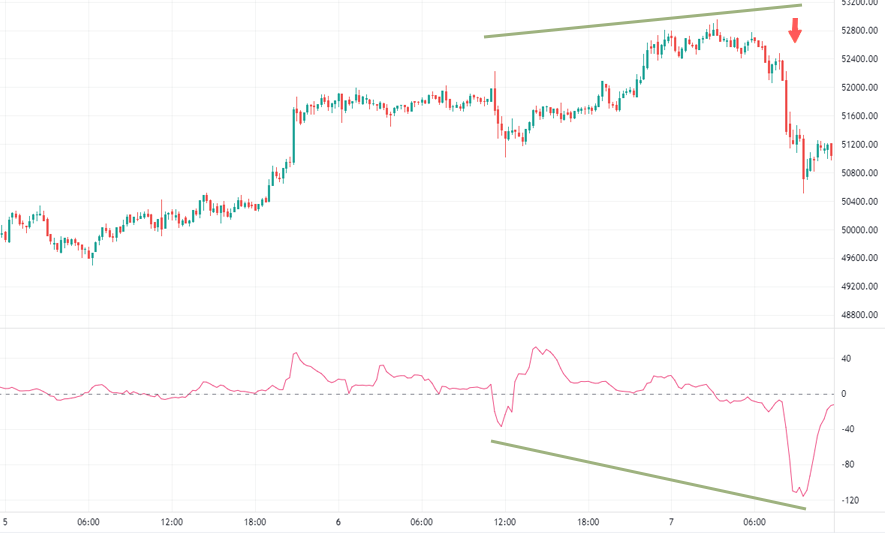
Here you can see the price moving in divergence with the indicator, indicating that it is overbought, selling pressure is increasing. That’s a sell signal.
Zero line signals
Use the Chaikin Oscillator to find directional trends in momentum.
When it crosses the zero line from below, it is a buy signal.
Conversely, when it crosses the zero line from above, it is a sell signal.
Advantages
- The main advantage of the Chaikin Oscillator is its ability to give a leading forecast of changes in another Chaikin’s indicator – the Accumulation Distribution Line indicator, by values of which it is calculated. It gives traders using it an advantage to buy closer to the “bottom” and sell closer to the “peak” price. Using Chaikin Oscillator as a part of trading systems allows increasing their efficiency.
- The indicator sends out correct entry and exit signals that good works for intraday traders.
- The signals are clearly separated: indicator provides buy signal and sell signal.
- The indicator is available on any trading platform in every good charting software for you.
- The Chaikin Oscillator does not redraw its values as most custom indicators do.
- The Chaikin Oscillator can be successfully used in trading systems where other, classic oscillators are used.
Disadvantages
- The main disadvantage of the Chaikin Oscillator is its excessive flexibility. Crossing the zero line occurs extremely abruptly, making it difficult for a trader to identify the exact entry point. False signals on the Chaikin’s indicator entry can be very frequent. Therefore, day traders use the Chaikin indicator only together with other oscillators, which would filter its readings.
- The second disadvantage can be considered the insufficient length of both EMAs. Especially when compared to the classical moving averages, on the basis of which the calculations are made.
- As we found out earlier, the Chaikin Oscillator provides signals with a delay, because it receives information by analyzing another technical indicator, which also has a delay.
- It most effective works when the market is trending, not effective when the market moves sideways. In this case, the indicator’s line starts to provide false signals, which lead to use other indicators (such as moving averages or ATR indicator) to compensate this or wait when there will be a trending market again.
- It shows different results for different crypto assets. Before begin to use this indicator you should backtest it with different parameters for different crypto assets. Pay attention to price volatility.
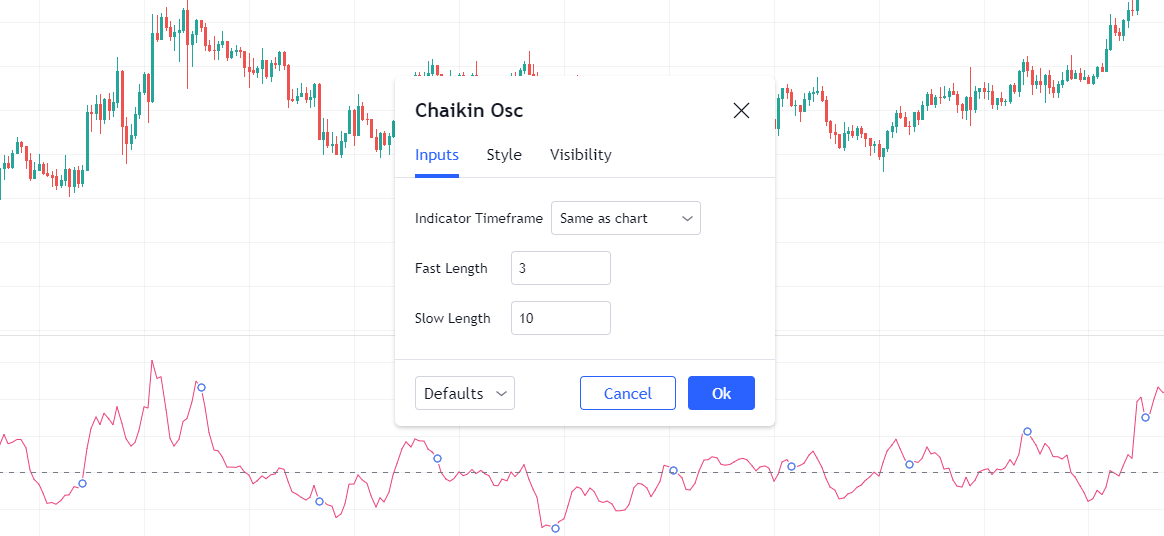
Best setting
The Chaikin Oscillator includes just two parameters, a fast length, and a slow length. By default settings, it has a fast length of 3 and a slow length of 10, which is good for day trading.
Trading strategy
There is the most common way of working with the Chaikin Oscillator: trading from zero line crossings on divergences.
Chaikin Oscillator is a rather complicated indicator to calculate and apply. It is both an advantage and a disadvantage.
By measuring the momentum of the accumulation/distribution line using the MACD model, the Chaikin Oscillator must predict when the line will change direction. And it happens at the moment when we are already several levels away from the cryptocurrency price, which is inherently a lag, It is a delayed reaction by the Chaikin Oscillator to the price action. But although professional traders argue that this time lag is exactly what is needed to determine the importance of volume flow and price momentum. As you remember MACD indicator has this lag as well which does not prevent it from giving out clear signals at times.
So it is the experience of using the indicator in different states of the market that is key, to be able to apply it as effectively as possible depending on the stage of the market. This is also true for any other technical indicators.
How else can we use Chaikin Oscillator?
Investment advice from indicator creator Mark Chaikin:
Trend-following signals are always more reliable than signals that are against the trend when the price reversal happens.
Even if the Chaikin Oscillator confirms a new price extremum, it cannot be considered as a signal of trend continuation in this direction. The author considers such cases as not deserving special attention. It should be remembered that this type of signal is based on the past performance of the price chart.
If the Chaykin technical indicator changes direction it can be considered a trading signal only if it coincides with the general trend of the trading asset.
For example, an asset is growing and its price is above the 90-day exponential moving average. In this case, an upward turn of the curve placed in the area below zero is perceived as a message to buy.
However, if the crypto asset is below the 90-day exponential moving average, it is better to ignore this reversal until you get confirmation from other analytical tools such as Money Flow by Chaikin of any other momentum indicators that you use in a day trading.
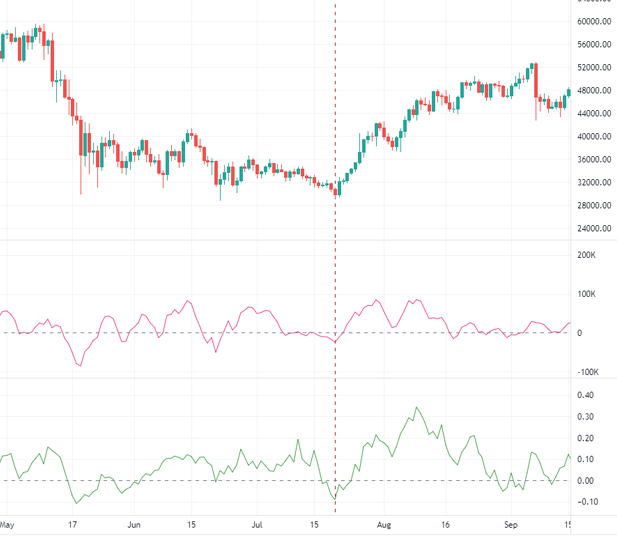
On the chart above you see a strong signal to buy that represents impending price reversals followed by good price momentum. Chaikin Oscillator moves, money flow (green line) send confirmation buying pressure increases.
Chaikin Oscillator generates signals to buy with an upward turn of its line and crossing zero line. Also, money flow (green line) sends confirmation on this, as result buying pressure increases.
However, when the Chaikin Oscillator line turns down in the “plus” zone, it is important for the crypto asset to be below the 90-day exponential moving average. Only if these conditions are met can we seriously consider selling.
Such technical analysis is presented below:
Once a bullish divergence has occurred, we recommend buying the cryptocurrency pair only after confirmation of price acceleration when the Chaikin Oscillator crosses its Zero Line from bottom to top. This means that there is a signal from two moving averages.
The fast-moving average is crossing the slower moving average from bottom to top, which is based on the Accumulation/Distribution indicator.
Conversely, once a bearish divergence has occurred, we recommend selling the cryptocurrency pair only after crossing its zero level from top to bottom.
For the best technical output, it is worth trying to change the lengths of the Chaikin Oscillator.
The bottom line
The Marc Chaikin oscillator is one of the technical analysis tools that provide trading signals for day traders that help identify trend changes in the accumulation/distribution line by measuring the momentum behind price action.
The Chaikin indicator is best used in conjunction with other technical indicators to confirm price trends.
It is effective in combination with various indicators designed to determine the trading range, such as Moving Average envelopes or Bollinger bands.
Also, good results are obtained by using Chaikin Oscillator in combination with oscillators of oversold/oversold conditions, such as RSI, Money Flow Volume, or Balance Volume.
Besides, unlike many similar instruments, the oscillator does not overdraw its values. It fits well into modern trading systems, being organically combined with other methods of Technical Analysis.
The use of the Chaikin Oscillator is allowed mainly in the trend market with sufficiently high volatility because in this case, the Chaikin indicator works well enough.
In the case of a flat (sideways) movement, the oscillator will give a lot of false signals. It turns out that if you combine all of these signals at different timeframes, you can create a complete trading system based only on Chaikin`s Oscillator.
The Chaikin Oscillator is the author’s development of a successful trader, who in this indicator has expressed his view of the market and its analysis. Its characteristic feature is applicability to any market, including crypto markets.