- What is the Divergence Indicator?
- How does the Divergence Indicator work?
- The types of divergence
- How to identify Divergence?
- What is regular Divergence?
- What is hidden Divergence?
- Types of hidden Divergence
- How to trade Divergence?
- Final thoughts
What is the Divergence Indicator?
Overview
A divergence indicator is a tool that detects and signals when a divergence occurs, whether it is a regular divergence or a hidden divergence.
If you are experienced in trading using Moving Average Convergence Divergence (MACD), you know that it usually produces signals at regular divergences and when MA crossings. Also, if you trade with Relative Strength Index (RSI), Stochastic oscillator, Commodity Channel Index, or other momentum indicators, you are also familiar with the regular divergences.
In this article, we will also learn that there is a hidden trading divergence, another type of divergence, which is rarer and can also be used in trading. This is the main feature of this indicator – it shows both normal and hidden divergences.
This way we will know with high probability when a trend change can occur. And we won’t even need to laboriously search for the divergence on the chart of a trading instrument. This indicator shows when a divergence happens by marking it on the very chart. So you will not miss a trading signal even if you do not know how the divergence is calculated and how it is forming on the chart by the price action. We will also look at the use of the indicator in trading strategies.
How does the Divergence Indicator work?
The types of Divergence
There are two main types of divergence which contain other types of divergence. These are Regular and Hidden divergences. Guess what is what from the examples below (all attention to the purple highlights):
1)
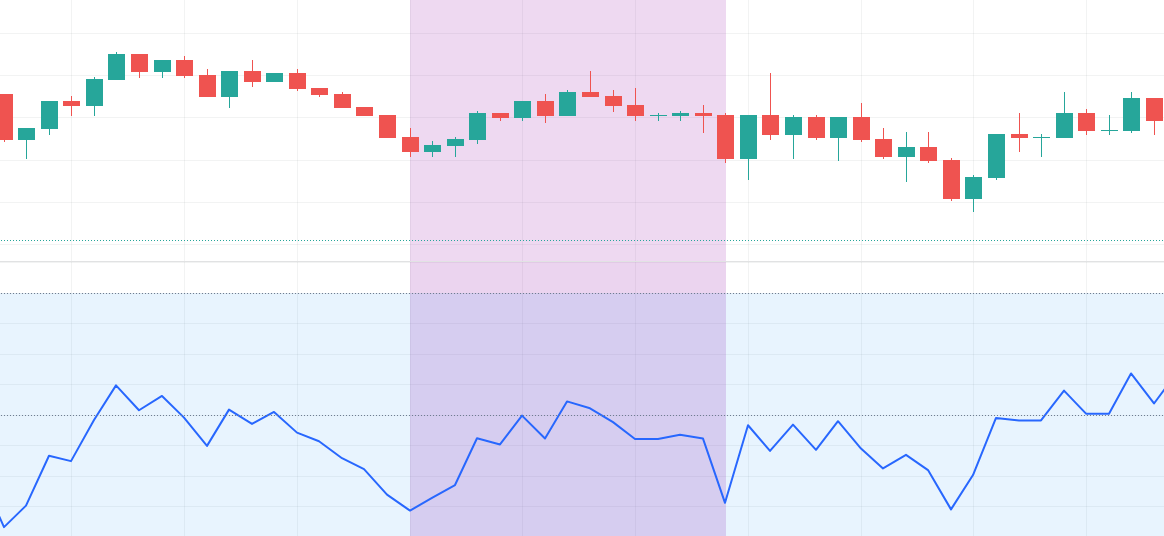
2)
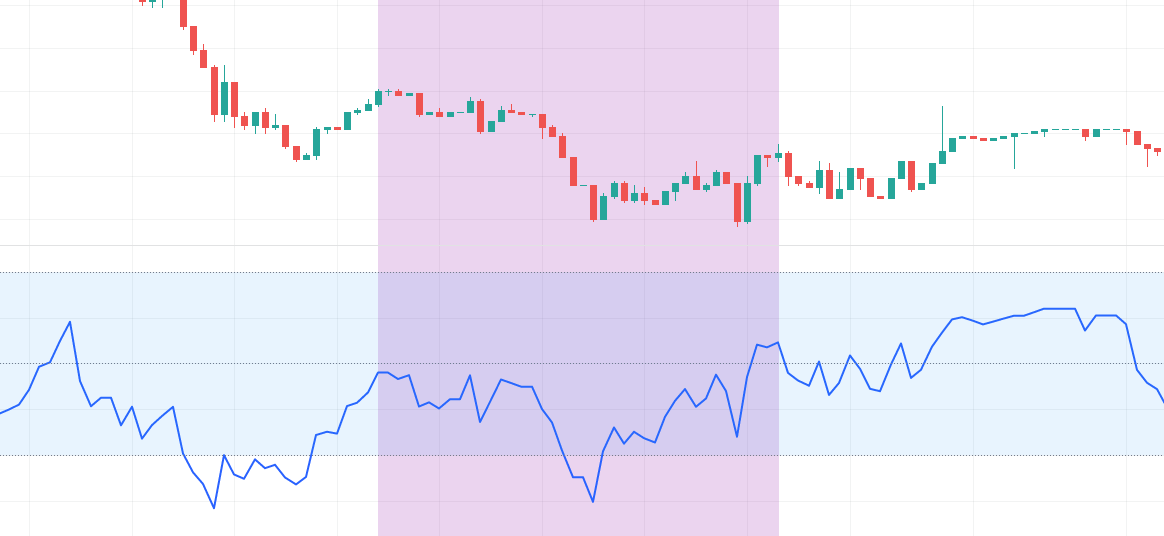
You will find the correct answers below.
How to identify Divergence?
Divergence happens when the price of crypto-asset moves in the opposite direction from a technical instrument, such as an oscillator. This occurs when the price keep moves lower and the technical instrument line moves higher or shows bullish signals.
Divergence in technical evaluation can signal whether it’s overbought or oversold crypto-asset. Positive divergence occurs when the price reaches a new low and a tool, such as the MACD or Money Flow Index or any other momentum indicator, conversely begins to rise. Conversely, a negative divergence happens when the price is about to reach a new high, but a tool makes a lower high.
Traders use divergence to analyzing cryptocurrency’s underlying momentum. How does the price behave? Is it slowing down or accelerating in its price action? Based on the answers to these questions, they draw their conclusions and make trading decisions.
As an example, some traders may put the Relative Strength Index (RSI) or any other momentum indicator on the price chart. If the crypto-asset you are trading rises and reaches new highs, it is advisable that your indicator also reaches new highs. If the crypto-asset reaches new highs and your chosen indicator starts to decline, it signals that the upward price trend is weakening. This could indicate a perceived change in trend with a high probability. This is known as negative divergence.
What is regular Divergence?
So now let’s get into the specifics. A regular divergence happens when crypto-asset reaches higher highs in an uptrend while the indicator does the exact opposite: it shows lower values on its histogram or chart. Conversely, if the price is in a down-trend, the trading asset makes lower lows, while the indicator makes higher highs as peaks on its chart.
Regular divergence is a leading signal because it can accurately detect tops and bottoms, allowing traders to enter the market more precisely and do so at the right stage of the market, regardless of which way the trader opens: up or down. This is another tool to indicate a possible trend change.
Regular divergence has two patterns, one of which is a regular bullish divergence. It occurs when the price reaches lower lows and the oscillator registers higher lows during a downtrend. Thus, a normal bullish divergence indicates a possible market reversal or a short-term correction.
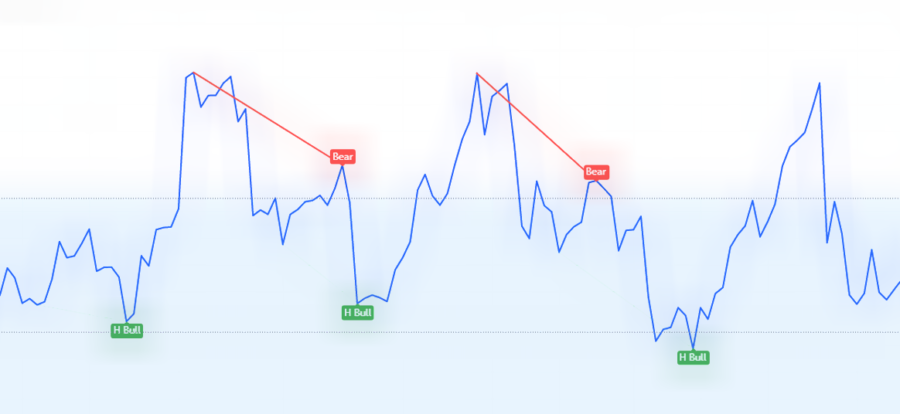
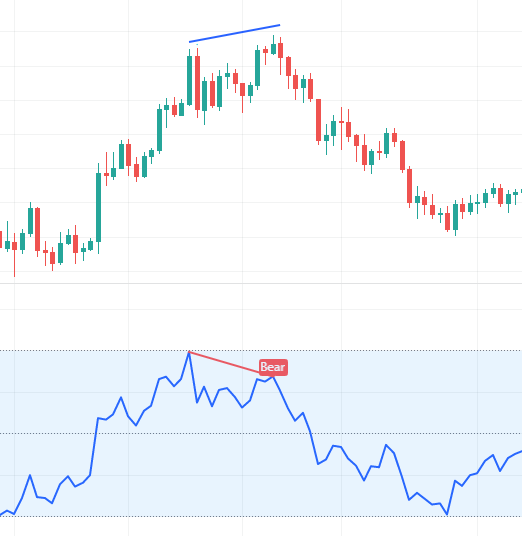
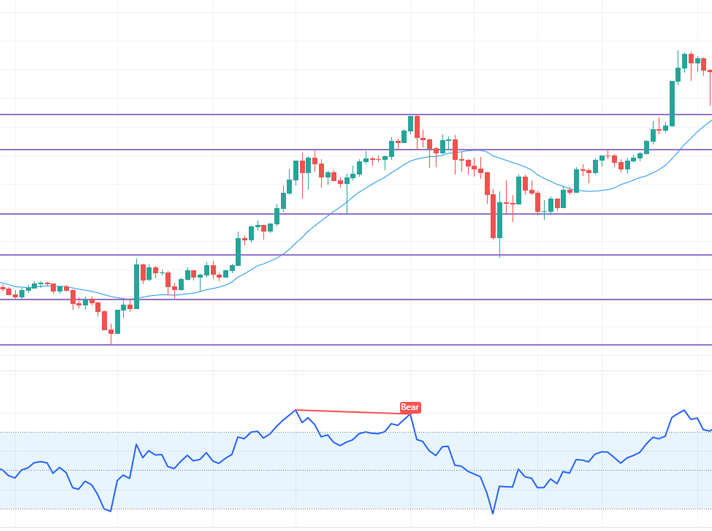
The second model of a regular divergence is a normal bearish divergence. It appears during an uptrend when the price continues to rise, setting new highs but the indicator shows a lower high. As you can see on the picture above, the price of a crypto-asset was in a strong bullish trend and was aiming for new highs. But the indicator did not capture a new high, which is a strong alert of the market`s overbought and a possible alert of a trend reversal or at least a short-term correction.
What is hidden Divergence?
In addition to regular divergences, we also have hidden divergences. Hidden divergences indicate a continuation of movement in the direction of the prevailing trend, and this is the main difference between regular and hidden divergences. In comparison to the regular divergences indicating a possible trend reversal, hidden divergences serve as confirmation to open trades within the trend.
Hidden divergences as a regular one also have two models: one of them is also bullish, and the other is bearish.
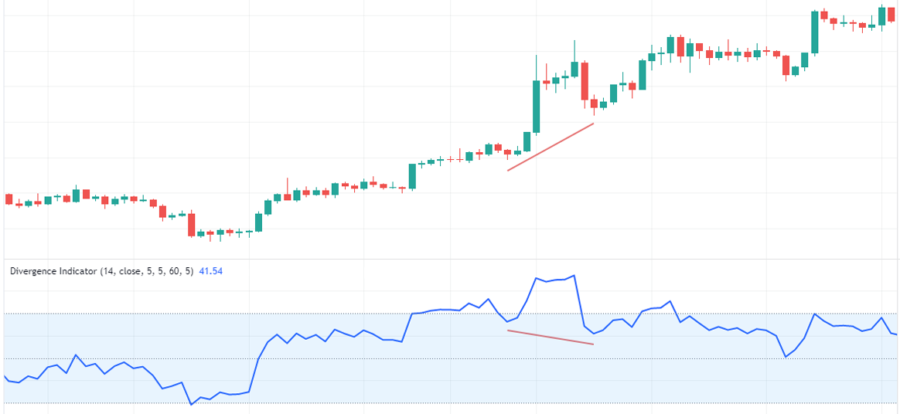
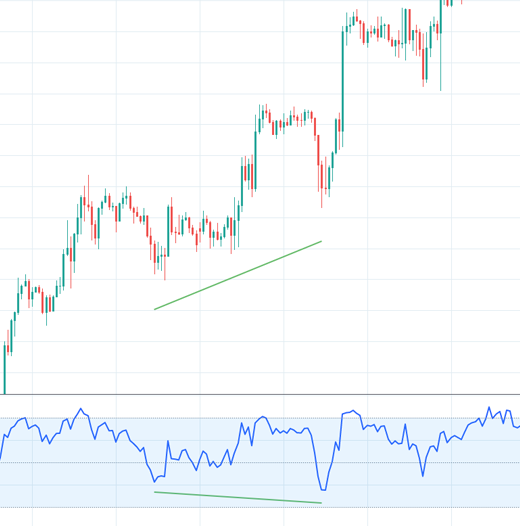
Let’s go straight to an example: in the picture below, the price was in a very strong uptrend, then it rolled back and resumed its initial uptrend. Then another pullback was recorded, and you can see that price did not make new lows and closed above the previous downtrend. The divergence indicator has recorded a lower low, forming a hidden divergence which indicating a possible uptrend.
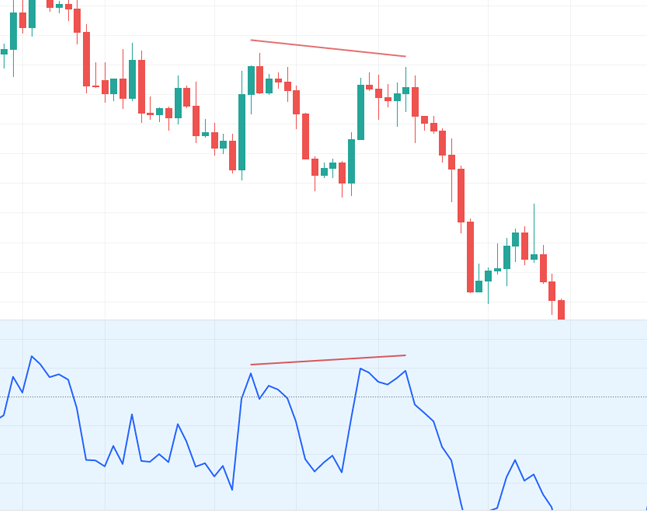
In the case of bearish hidden divergence, the indicator reaches higher highs while the price of the trading instrument reaches lower highs. This type of pattern appears mostly during a downtrend correction. In this example, after an uptrend, the crypto-asset showed a downtrend and the price made lower highs, but the oscillator recorded higher highs, forming a hidden divergence type.
Types of hidden Divergence?
Hidden divergence has two patterns: bullish hidden divergence, in which the oscillator shows lower lows and the price shows a higher low.
The price on the chart was in an uptrend, then a correction has occurred. The price resumed its initial uptrend and then the price failed to record new lows and closed above the previous downtrend. The oscillator recorded a lower low, forming a hidden divergence which signaling a possible uptrend.
As you may have noticed the hidden bullish divergence has done its job well and we are in quite a profitable trade, the market has worked out well.
Also, we have a bearish hidden divergence. In this type of divergence, the indicator swings towards higher highs while the price shows either lower highs or double-bottom highs. This type of pattern appears mainly during a downtrend correction.
In this example after a strong uptrend recent price action showed a downtrend. The price made lower highs, even though the price was making lower highs the oscillator was registering higher highs forming a hidden divergence.
How to trade Divergence?
Trading signals
It would be very useful to add additional signals from another technical indicator to the divergence signals as filtration to make your trading better.
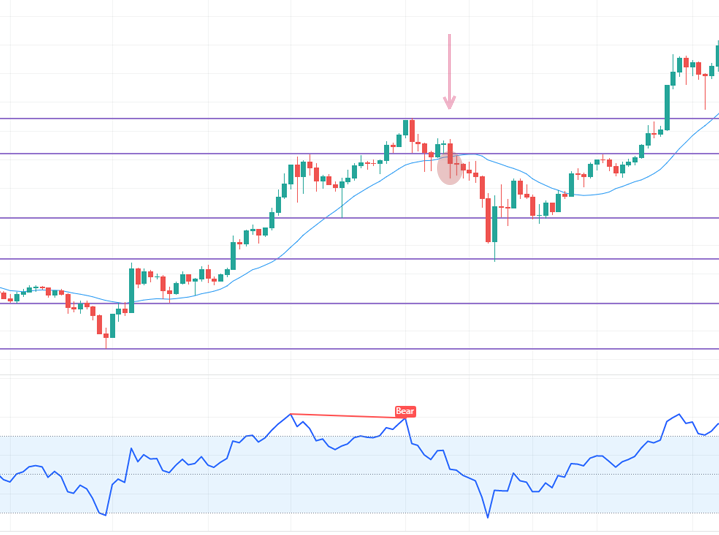
To avoid trading entries that lead nowhere, I highly recommend adding a 20-period moving average to your chart. When you see a divergence, you should open a trade when the price breaks the moving average. Such a scenario is much more likely to lead to a real changing in trend and you can avoid a lot of wrong entries.
When occurs changing in trend most traders sell during an uptrend or buy during a downtrend. Actually, divergence as a signal makes you wait until the price starts to change completely. Together with the moving average, you completely avoid predicting movements and only trade after confirmation.
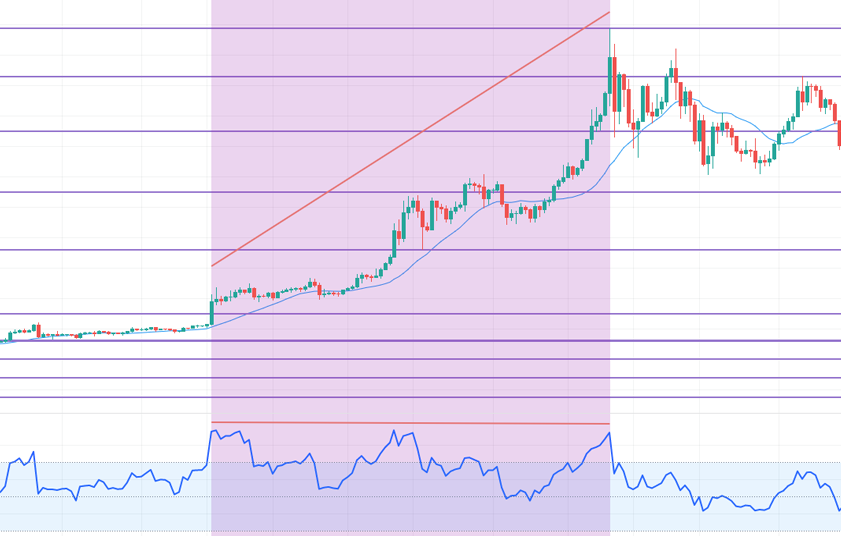
Also, you can draw lines representing trading levels between which the price moves as in the picture below:
Here you can see how we have combined all three methods.
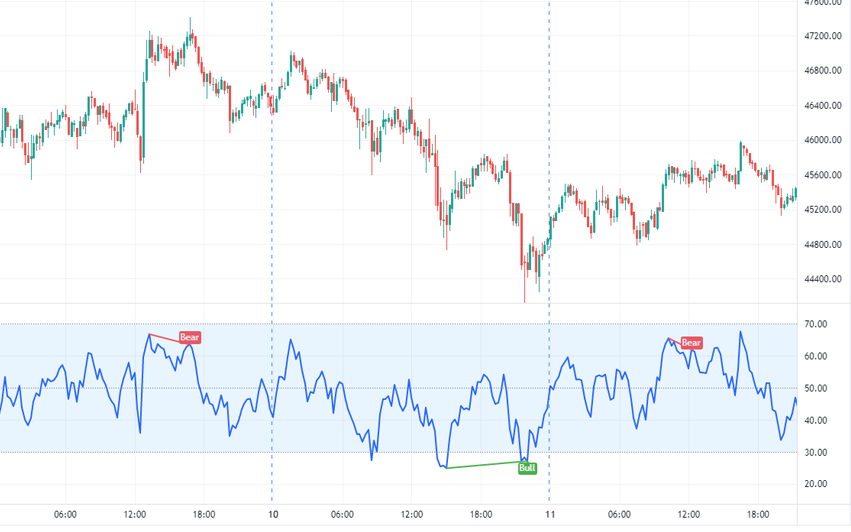
Here we got three sell signals at once: a regular bearish divergence, a bounce from a resistance level with a subsequent break of a support line, and crossing of the Moving average’s line. The entry point is right after the close of a red candlestick below the MA’s line.
At this point, we open a Buy Down. Price is making a good move and we have just learned how to enter a trading divergence.
We can use the divergence indicator as a leading indicator. Set up the divergence indicator and monitor its signals simultaneously on the different time frames. For example, let’s take D1, H4, M15, M5.
D1 and H4 use to determine a current trend or approaching trend reversal.
Use additional timeframes M15 and M5 to determine a more accurate intraday entry point.
The best time to make a trade is when the price has broken the Moving average line and tested it from the opposite side. In this case, the stop order is traditionally placed behind the last price extremum.
It would also be useful to learn how to identify the onset of a flat. As trend-following strategies do not work at this stage of the market. A weak divergence will help us identify this point. Weak divergence can be seen when price makes a higher high or a lower low, or when the oscillator stops at the previous level, forming a ‘double bottom’ on its chart. The example below:
In an uptrend, the indicator chart recorded three highs at the same level, while the price of the trading instrument updated high after high.
You should also remember that when a divergence happens, it does not mean a reversal is imminent. Divergence can last for a long time. It can take a long time to form, even longer to work out by the market price so if the price reacts differently than expected, it can lead to significant losses.
Final thoughts
Divergences can provide traders with very good signals for making profitable trades, but occur relatively rarely. In case if you`re going to trade divergence only, these will be rare enough signals to be more suitable for a long-term strategy, than for daily high actual trading.
A previous trend must be present for a divergence to occur. Note that trying to find divergence in a previous sideways trend is useless. Divergence signals from technical indicators are amplified by increasing volume in the direction of a price trend breakdown. This confirms the injection of professionals` money into the trend change. Conversely, in the last phases of the movement in the direction of the ending trend the trading volumes start to take minimum values, as the market professionals do not support the price movement in the direction of the previously dominating trend.
Another factor that increases divergence is the release of any significant news at the moment when the price trend breaks. In this case, the fundamental analysis is combined with the technical analysis, and they reinforce each other. That’s the best way to trade divergence.
It is useful to compare divergences of technical tools with classical technical analysis, trading volume analysis, as well as general news background.