Origin of harmonic price patterns
Harmonic patterns are elements of technical analysis that combine chart patterns and Fibonacci values. The purpose of such models is to find pivot points on the chart and predict future price movements.
Harmonic patterns were first mentioned in 1935 by Harold McKinley Gartley in his book “Profits in the Stock Market”, but there was no mention of specific Fibonacci values. H. Gartley described many points on working with a trend, moving averages, price moves models, gaps, and so on. But one pattern he paid significantly more attention and pages in his book than others.
This pattern appears in the book on page 222, and after that, for all readers and future generations of traders, it acquires the name “Pattern 222.”
Today, it is not referred to as the “Gartley” model, therefore, in the rest of the text, we will refer to this pattern as well.
Harmonic theory research was continued by Scott Carney and Larry Pesavento. It is described in the books “The Harmonic Trader”, “Fibonacci Ratios and Pattern Recognition” and “Profitable Patterns for Stock Trading”.
Larry Pesavento practiced Fibonacci numbers in his trading strategy and he is the first man who thought to combine geometric price patterns with Fibonacci retracements. As Larry himself wrote, he used the square root of Fibonacci numbers and created 10 basic patterns. He calculated the following fibonacci levels: 0.236, 0.382, 0.618,0.786, 1.27 and 1.618.
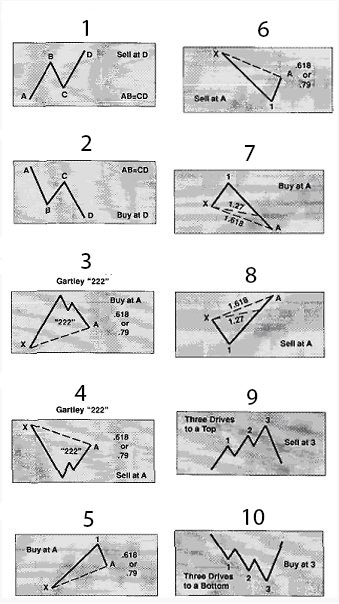
Patterns Every Trader Should Know About
1. ABCD pattern
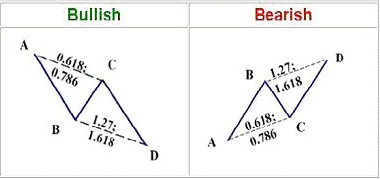
A simple harmonic pattern consisting of only 4 points, it resembles the letter N. An important condition for this formation is AB = CD, but not only in length, but also in time. The BC line is a correction and is equal to 61.8% of AB.
If some pattern assumes further upward movement, then it refers to bullish patterns, if it predicts a downward movement, then it refers to bearish patterns.
This pattern is a simple one and mainly not used for opening positions, but it is an integral part of other harmonic patterns (complex patterns). One of them will be discussed further.
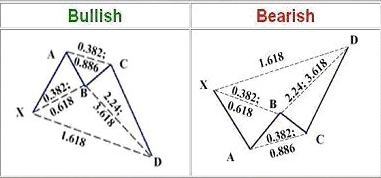
2. Gartley pattern
This is one of the most profitable formations, it is quite common and highly effective. Gartley is a trend continuation figure, it means that it predicts that the price will continue its move in the same direction. It consists of ABCD and the XA segment, where XA is part of the trend, and ABCD is a correction to the trend.
Allowable proportions for identification:
- AB = CD
- AB = 0.618 XA
- AD = 0.786 XA.
- BC = 0.618 (0.382 to 0.886 AB)
- CD = 1.272 or 1.618 BC (preferably 1.618)
Potential reversal zones are located behind D point, where you can open a position and enter the market. You may wait for the formation of D, or place a pending order when the desired price is reached. Stop loss is usually set at level X. The first target for taking profit is located at the level of point A, where you can take at least half of the profit.
Scott Carney in his book “The Harmonic Trader” described all specific fibonacci ratios, highlighted the acceptable for the Gartley model and indicated the required ones. The pattern may resemble the Bat model, however, Gartley has unique Fibonacci proportions, but the pattern must be symmetrical to be more likely to work out.
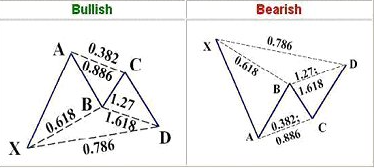
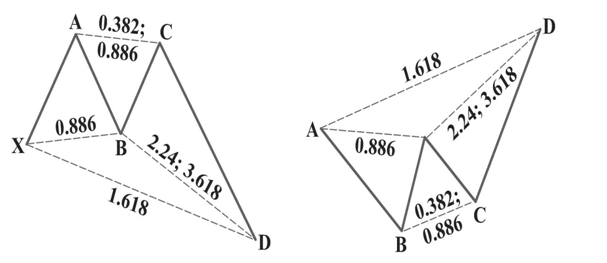
3. Bat pattern
Discovered in 2001 by Scott Carney.
Allowable proportions for identification:
- AD = 0.886 XA
- AB = 0.382 XA or 0.5 XA (preferably 0.5)
- BC = 0.886 or 0.382 AB
- CD = 1.618 or 2.618 BC
It is necessary to pay attention to the differences from the Gartley pattern, namely, that the entire pattern should correct the XA movement by a larger value (0.886, not 0.786). This is an important condition, since if the price goes beyond the ratio 1, then the pattern will lose its validity and become irrelevant. And the correction at point B should be less than 0.618, preferably 0.5 or 0.382.
It is also important to note that the ABCD model in that model usually requires CD lengthening so that CD = 1.27 AB
The Bat harmonic pattern has become popular with many traders for having the best risk/reward ratio of all harmonic patterns due to a deep 0.886 retracement from the initial XA move.
Entering a trade at the end of CD will provide good potential for movement and a small stop loss in case the pattern breaks. Stop loss, as in the case of Gartley, it is reasonable to place behind the X level.
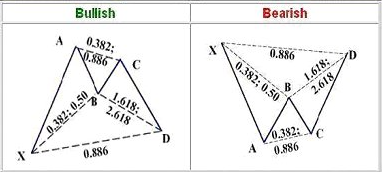
4. Crab pattern
This model was also described by Scott Carney. A distinctive feature is that reversal points (D) is outside the boundaries of the segment XA. The AD projection is 1.618 of the original XA move, or 2.24 to 3.618 of the BC move. Thanks to this, we have a fairly narrow potential reversal zone and can set a small stop loss. Once again, we will emphasize that AD = 1.618 XA, since this is a key point!
In addition, a longer CD should be noted in relation to AB for which many ratios are acceptable.
In a bullish pattern, point D is below X, and in a bearish D above X.
Allowable proportions for identification:
- AB = no more than 0.618 XA (preferably 0.618)
- AD = 1.27 or 1.618 XA. (1.618 is desirable)
- BC = 0.382 to 0.886 AB (desirable 0.618)
- CD = 2.24 or 2.618 or 3.14 or 3.618 BC (preferably 3.14)
5. Deep sea crab pattern
The distinction of a deep sea crab from the usual is a stronger AB move that reaches 0.886 XA.
Also, the compound pattern ABCD has a CD close to the ideal, for which 2 variants are acceptable, namely CD = 1.27 AB (As in the case of the Bat) or CD = 1.618 AB. The second option is the most common proportion. Otherwise, the ratios of the segments are the same.
The key is AD = 1.618 XA. Exceeding this threshold invalidates the model.
Speaking in general about the Crab Harmonic Pattern, it can be noted that this is a rather extraordinary model. The potential reversal zone, like other patterns, is located at D point, but it is characterized by sharp reversal price movements. Often the price touches the D level only briefly and reverses sharply. This is because the Crab identifies EXTREME overbought and EXTREME oversold.
6. Butterfly pattern
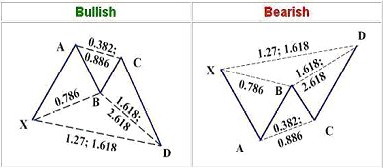
This pattern is similar in structure to our previous example, but a significant difference from the Crab pattern is that AB = 0.786 XA. In addition, at least AB must be equal to CD, or 1.27AB = CD. Most likely the CD will be able to have a stronger aspect ratio of 1.618AB.
Allowable proportions for identification:
- AB = no more than 0.786 XA (preferably 0.786)
- AD = 1.27 or 1.618 XA. (1.618 is desirable)
- BC = 0.382 to 0.886 AB (preferably 0.5 to 0.886)
- CD = 2.24 or 2.618 or 3.14 or 3.618 BC (preferably 3.14)
7. Model 5-0 harmonic pattern
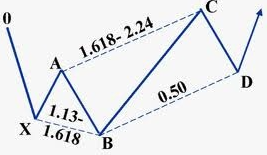
The model is quite different from the ones we mentioned earlier. This model consists of 5 points, but includes the presence of a starting point (0). In addition, the model is reversal.
The construction starts not from the X point as in other harmonic patterns, but from the zero point. The OX and AB segments are presumably the last impulses of the trend. In terms of Elliott Wave Theory, AB is a failed third or fifth wave, XA is its correction.
Allowable proportions for identification:
- AB = from 1.13 to 1.618 XA (no more!)
- BC = from 1.618 to 2.24 AB (not less!)
- CD = 0.5 BC
- AB = CD
At D point, the trend finally breaks down. The 5-0 pattern can be identified at the moment the C point is formed, the BC value must be at least 1.618 – 2.24 XA and is decisive.
We enter a trade at point D on a 50% correction (This is already a confirmation signal). Stop loss is set for the next retracement levels, i.e. 0.618 BC or 0.786 BC. Take profit is usually located at the border of a newly formed price channel.
It will take a long time to find patterns of this type at first. The main thing is to see a failed wave and an impulsive price move in the opposite direction by an amount from 1.618 to 2.24 by Fibonacci.
8. The three drives pattern
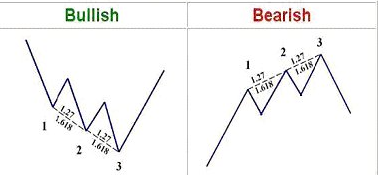
The three drives pattern has its origins in the Elliott wave theory. It is a reversal pattern.
It is easily detected on the chart due to the fact that the movements must have symmetry and be equal in time. However, the main criterion for its validity is that each next move ends at 1.27 or 1.618 from the previous one.
How to find harmonic patterns?
This is not an easy task, but with a little time, everyone can find harmonic patterns on their own.
If we are talking about bullish pattern, then first look for places on the chart when the price made a top, but could not break it, but made another top lower than the previous one. Thus, you have two tops, which presumably will be points A and C. It’s time to take the Fibonacci retracement and measure trend correction between the tops, as well as measure the correction of the correction.
For convenience, you can use the XABCD tool, which automatically calculates pattern proportions. Thus, having received the proportions, we can identify a specific pattern. There are many useful Fibonacci tools on our platform. Besides the fibonacci retracement tool, look out for Fibonacci extensions such as the trend-based Fibonacci extensions.
Similar actions can be taken to find a bearish pattern.
Сonclusion
As a conclusion, I would like to note that harmonic analysis works on all time frames – on hourly, daily, weekly or monthly charts, good trading opportunities appear every day.
The last thing I would like to warn you against is price gaps. Gaps can be caused by news or economic data released. They are undesirable when forming harmonic patterns, as they significantly reduce the likelihood of pattern realization.
To increase the likelihood of a correct forecast, it is better to use harmonic patterns in conjunction with price action trading strategies, technical indicators, candlestick patterns and pay attention to important price levels. Don’t forget about money management and don’t use too much leverage, as high leverage is a high risk of losing money rapidly.
That’s all. Good luck in harmonic trading!