- What is TRIX?
- TRIX calculation
- Why so interesting?
- Signals to watch for
- Indicator settings
- Ready-made trading strategies with TRIX
- Advantages and disadvantages
- What is the bottom line?
What is TRIX?
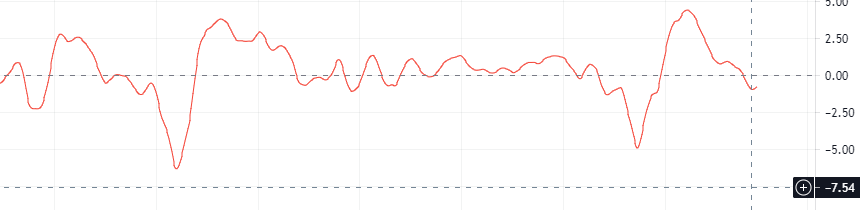
Triple exponential moving average (TRIX) is an oscillator indicator that allows you to determine the overbought and oversold zones of an asset, as well as the strength of the momentum. Its principle of operation is threefold smoothing of the weighted average moving average. Moreover, the last candlestick values and data from smoothing are given greater importance, since EMAs are used in the calculations.
Calculating TRIX indicator
We first calculate an exponential moving average based on the closing prices of 18 candles. Then an exponential moving average with the same period is calculated, and the third EMA is superimposed on the result again. After receiving the triple exponential average, the percentage change over 1-period is calculated to measure momentum. TRIX is ready. The triple smoothed moving average shows the trend, while 1-period percentage change measures momentum.
Why is triple exponential moving average so interesting?
Do you want to predict market direction with the least number of false signals? Then you need a TRIX. While most similar oscillator indicators give a lot of false signals in a short term, TRIX uses its triple smoothed EMA to filter movements and eliminates market noise. Obviously, this reduces the number of unprofitable entries into the position and leads to profit in a long run.
TRIX indicator trading signals
Cross of zero line (signal line)
One of the ways to use the TRIX is to use it as a momentum indicator. Here we will need to pay attention to the moments of intersection of the indicator curve with the zero line, or as it is also called a signal line. Receiving a signal line cross is the main and the easiest way to use TRIX. When TRIX crosses the zero line upward and gets a positive value, we receive a signal that the trend is likely to develop upward with a bullish bias. And on the reverse side, when the TRIX line crosses zero line from top to bottom and get a negative value, then we can assume that the downward trend will continue as we received a sell signal.
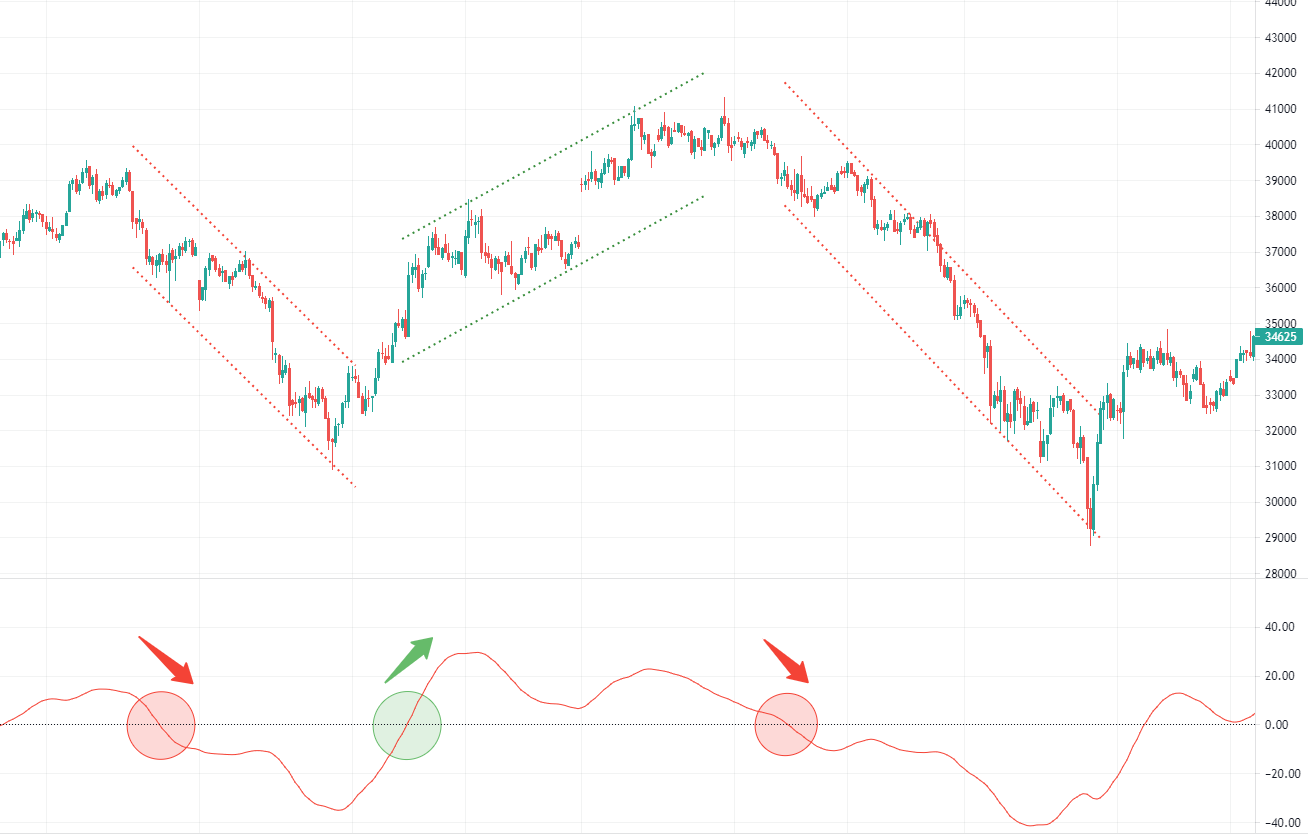
As we can see, the example shows 3 signal line crossovers (2 sell signals and a buy signal) which we can use to enter a position. Moreover, the indicator does not generate a signal in case of small corrective movements within the framework of the main impulse movement. They are filtered out as market noise because TRIX uses triple smoothing in its calculations. This type of signal is most suitable for trending markets.
Divergences
Now let’s look at the same chart and try to find signals of a different type – divergence. Divergence is a perfect tool to predict bullish reversal or bearish reversal. Divergences occur when the price chart moves in one direction and the indicator readings move in the other. Divergences are very important in chart analysis as they allow trader to find significant turning points.
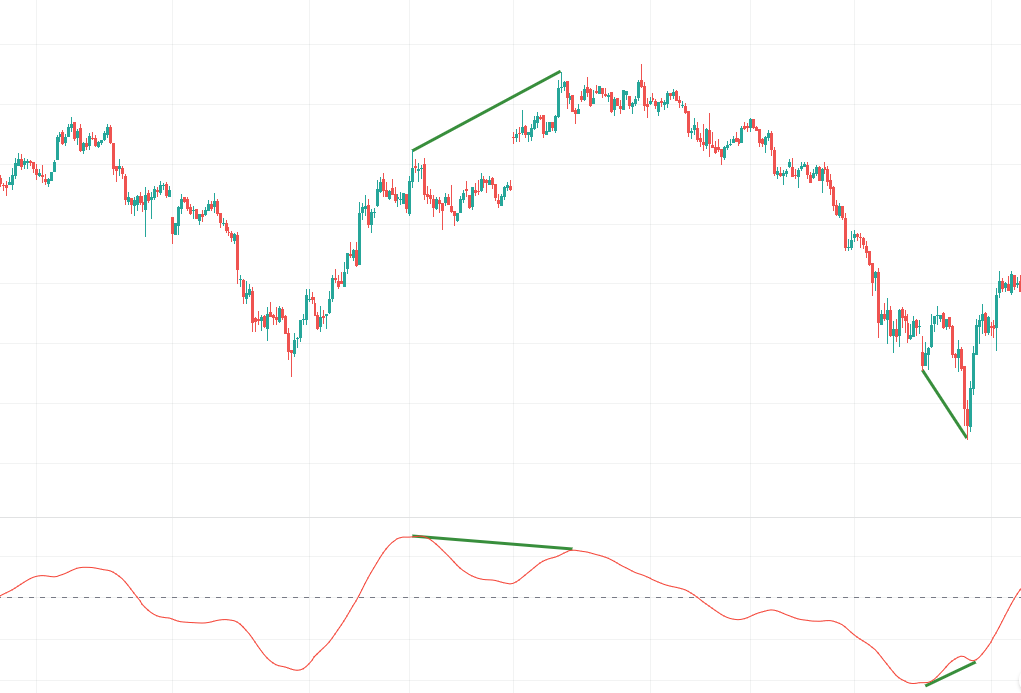
In this example, we may observe bearish and bullish divergences. When each next high on the chart is not confirmed by a high on the indicator, a bearish divergence is formed. This indicates the weakness of the upward movement and a possible reversal. And in the opposite direction, when each new low on the chart is not confirmed by the next low on the indicator, a bullish divergence appears.
Bullish and bearish divergences on TRIX are the strongest signals for a possible trend break or the beginning of a correction. It is reasonably to take them into account in trading strategy. However, it is worth remembering that with strong trends, double, triple and multiple divergences can be observed.
MA crossing
As an addition to the TRIX, you can apply an exponential moving averages to the indicator line. Trading signals will be generated when these moving averages will cross. However, it should be noted that in this case indicators will be lagging and will give quite contradictory signals. Therefore, if you want to follow this trading method, then it would be reasonably to apply TRIX with a moving average on higher timeframes.
TRIX settings
The indicator can be customized by decreasing or increasing the number of candles used in the calculation. Increasing the number of periods will decrease the sensitivity of the indicator. It may be more useful for long time traders. Decreasing the number of periods will increase the sensitivity of the indicator. If you are a short time trader, you better prefer such setting.
To adapt the indicator to your trading style as well as possible, it is best way to change the period by 1 in the indicator settings and look at the behavior of the TRIX in the chart history. After that, change the period by 1 again and see the result again. You need to repeat this action several times until you achieve the best indicator readings on the chart history.
It is necessary to achieve a balance in which there will be a small number of bad signals and a relatively large number of useful signals.
Different assets have different volatility. Therefore, TRIX will generate signals of different strengths on different instruments. And in some situations, there will be no signals at all.
Ready-made trading strategies with TRIX indicator.
TRIX combinations with support and resistance lines.
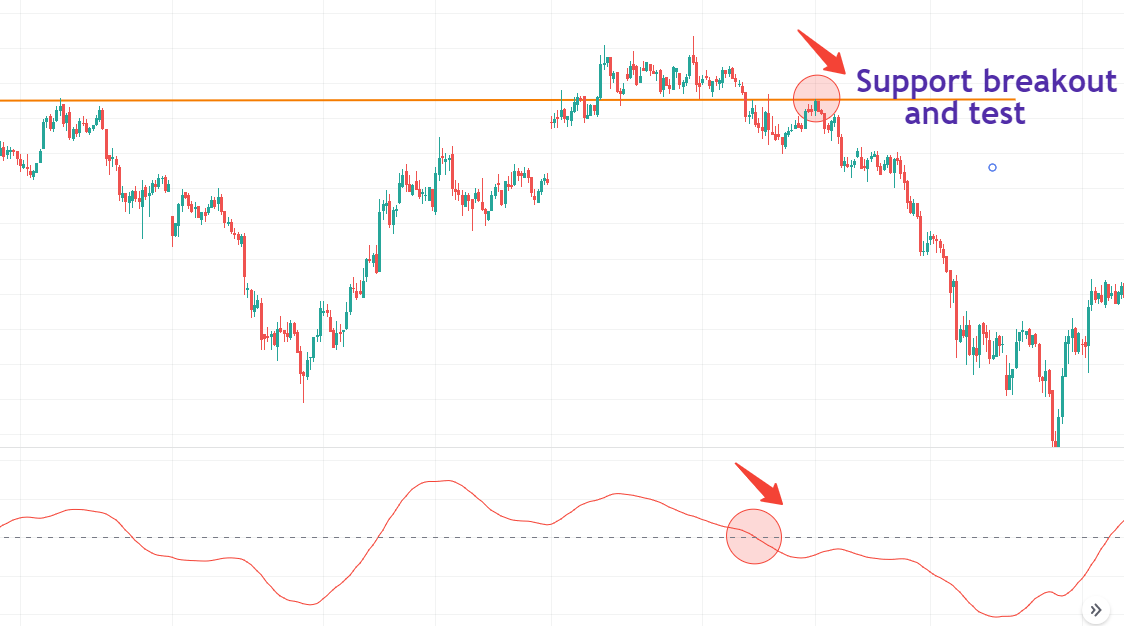
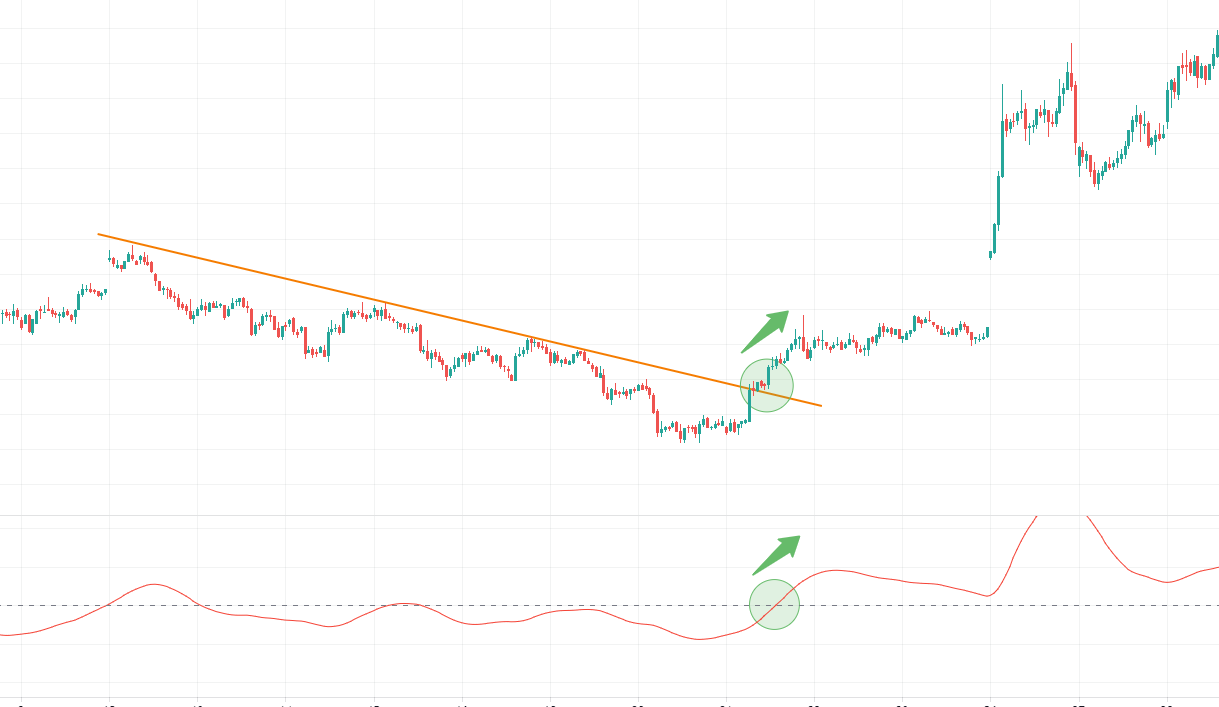
We will receive a stronger signal, which gives us an increased likelihood of further movement up or down, if we pay attention to the breakout of price levels simultaneously with the TRIX signal line cross. Combining price action strategies with indicator signals is a very good way to increase the likelihood of a price prediction.
On the screenshot example, we see how at first the TRIX indicator generated a signal, then the price broke through an important support level and, after testing the level on the other side, continued the downward movement. The strategy is to enter a position upon a breakout or when testing an important price level in the presence of a sell signal or buy signal from TRIX.
It is also possible to use TRIX together with the trend line breakdown. In general, combining TRIX with price action is always effective.
What are the advantages and disadvantages of using smoothed triple exponential average?
Advantages of the TRIX indicator
- Thanks to the triple smoothed EMA, TRIX is able to filter out minor market movements. It eliminates noise and minor short term cycles by focusing on the main impulse movement.
- Bullish and bearish divergences on the TRIX make it a leading indicator. They greatly help a trader to detect overbought market and oversold market.
- It has flexible settings, each user adapts it for himself and adjusts the signal accuracy. By default, the period is 18 candles.
However, TRIX indicator is not without its drawbacks
- Does not provide information on setting a stop loss. The trader sets the stop loss either independently or using other indicators.
- Using only one indicator may not bring a positive result, since TRIX is not devoid of false signals. Like any other indicator, it should be used in conjunction with other elements of technical analysis, signals from chart patterns, candlestick patterns or other indicators.
- Like other trend following indicators, it is not suitable for flat trading. If the price fluctuates slightly, then the indicator line will cross the zero line too often, giving a lot of false signals.
What is the bottom line?
We can use TRIX either as a trend tracking indicator or as an oscillator – each trader makes this choice himself, based on his preferences. The highest trading performance is reached when TRIX is using as a trend tracking indicator rather than a momentum oscillator. Indicators such as Moving Average Convergence Divergence (MACD) or RSI significantly outperform TRIX in the standard momentum oscillator category and identify oversold and overbought better.