The Aroon indicator
- What is Aroon indicator?
- What is aroon oscillator?
- What’s the point?
- How to use the Aroon indicator?
- Setting the indicator
- Pros. and cons.
- Conclusion
What is Aroon indicator?
Aroon is an oscillator indicator that reflects the strength of an upward and downward movement and helps to identify trend, focusing on the number of new highs or new lows reached by the price over a certain period of time.

This indicator was developed by Tushar Chande and described in his book “The New Technical Trader”(1994). He named it Aroon, because it means “dawn’s early light” in Sankript.
What are Aroon up line and down line?
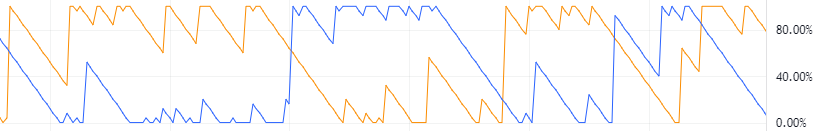
Aroon indicator consists of a scale from 0% to 100% and two lines moving within this scale – Aroon Up line and Aroon Down line (Some sources call them “aroon indicators”).
The first one is initially colored yellow and reflects the new highs of the asset. Aroon Down is usually colored blue and reflects new price lows.
The lines can be conditionally divided into bullish (yellow) and bearish (blue).
Aroon indicator has a simple calculation formula, which is one of its advantages.
Aroon Up line is calculated using the formula ((N – days since N-day high) / N) x 100
To calculate Aroon Down line, we use the formula ((N – days since N-day low) / N) x 100, where “N” is the number of candles taken into account, and multiplication by 100 is needed to get the result as a percentage.
The main levels of Aroon indicator are 0%, 50% and 100% levels:
- When the Aroon Up is above 50% and the Aroon Down is below 50%, it is generally accepted that a bullish trend is prevailing. And if Aroon Down is above 50%, and Aroon Up is below 50%, then a bearish trend prevails.
- If one of the Aroon indicator lines is kept near 100%, then this means a strong trend.
- When both lines move to 0% in parallel or are already in the range of 0% – 50%, this means that the traders have taken a wait-and-see position in the market, and the price is consolidating in a narrowing range without the formation of new tops and bottoms, while the volatility of the asset decreases.
What is Aroon oscillator?
The Aroon oscillator is a derivative of the Aroon indicator. It is calculated simply.
We need to take the Aroon indicator and subtract Aroon Up from Aroon Down and get the difference.
This difference is a curved line that takes values from -100 to 100. Therefore, when Aroon Up and Aroon Down lines of the indicator cross, the oscillator shows 0.
The oscillator has important levels at -80, 0 and 80. If the Aroon oscillator value is between 80 and 100, this indicates a strong bullish trend, and vice versa, values from -100 to -80 indicate a strong bearish trend.
The crossing of the zero line means a signal to buy or sell. It depends on the direction of crossing the zero line.
On the Aroon indicator, the same signal in the same places comes from the intersection of the Up line and Down line.
We will not focus on the Aroon oscillator any more, as it is less informative, but we will continue our guide about the Aroon indicator.
What’s the point?
The main purpose of the Aroon indicator is to identify trend and measure its stability.
The whole essence of this tool is due to the fact that any upward movement is characterized by the regular achievement of new tops, and the downward movement is characterized by the regular achievement of new lows.
How to use the Aroon indicator?
Aroon indicator strategies
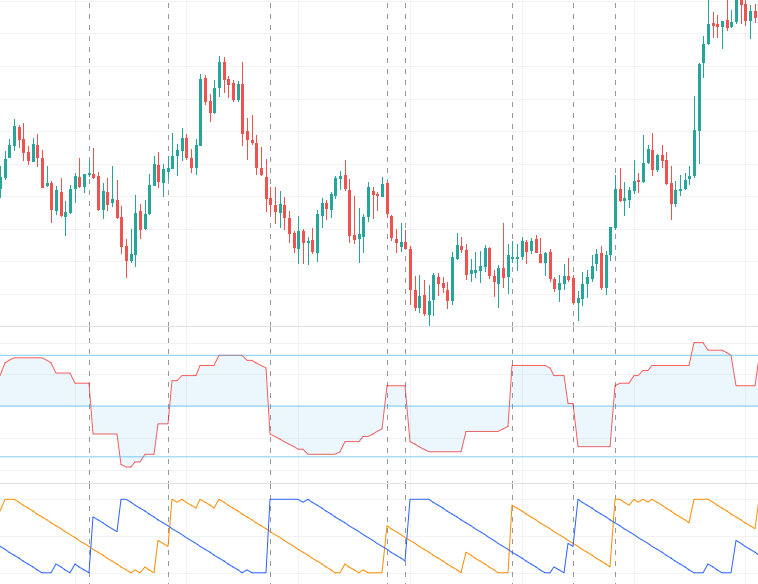
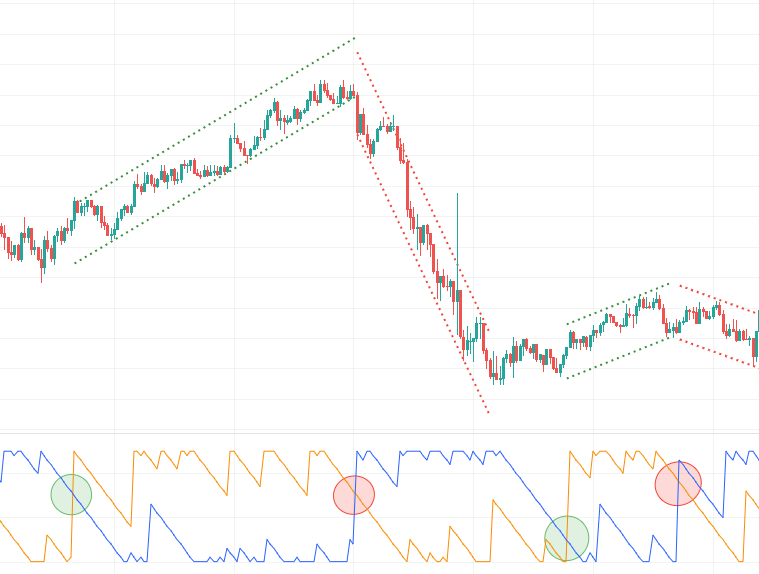
The most commonly used signal is the crossover of Up and Down lines.
When the Aroon Up crosses the Aroon Down from the bottom up, it means that bullish sentiment prevails among traders and the bullish trend is more likely to continue.
The same is true in the opposite direction. As an example, we see how the indicator issues 4 signals to enter a position: 2 up and 2 down.
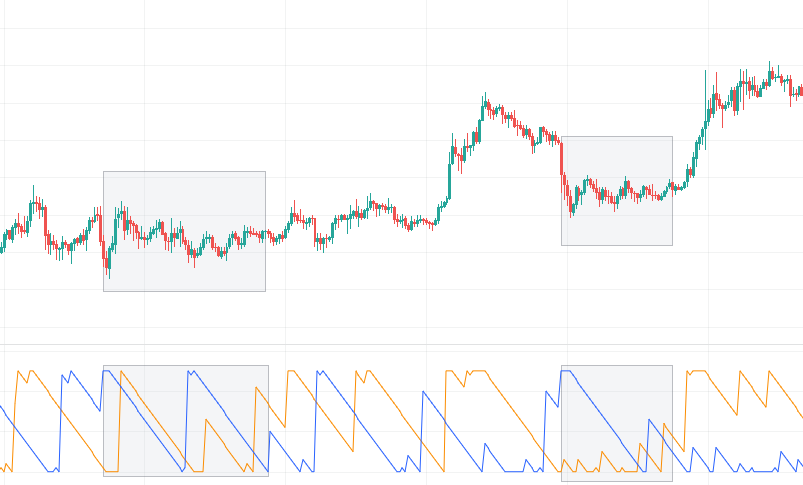
However, this indicator is not devoid of false signals when the crossover of Aroon Up and Aroon Down does not lead to a change in the direction of the trend.
The Aroon indicator generates many false signals during flat periods when there is no trend. In this regard, many traders add two auxiliary lines 30% and 70% to the indicator chart.
If we impose these lines on the chart of one of the examples above, we can filter out unnecessary signals.
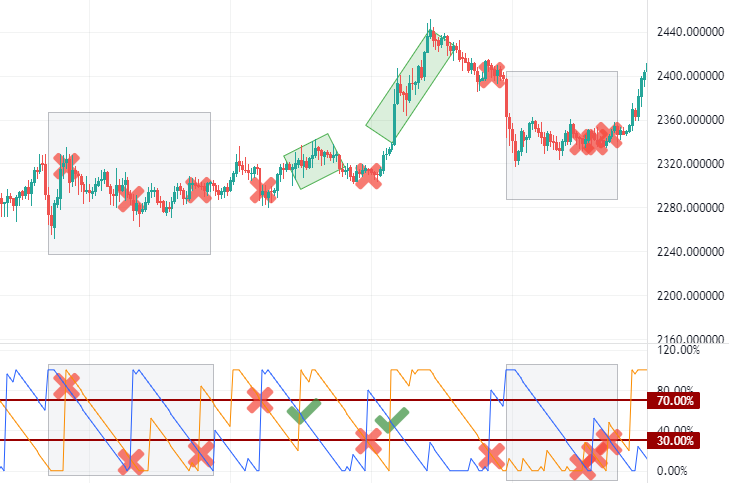
If the intersection does not occur in the range from 30% to 70%, then with a high probability we can assume that the signal will turn out to be false.
Also, the setting of the indicator, as well as the volatility of the asset, is of great importance.
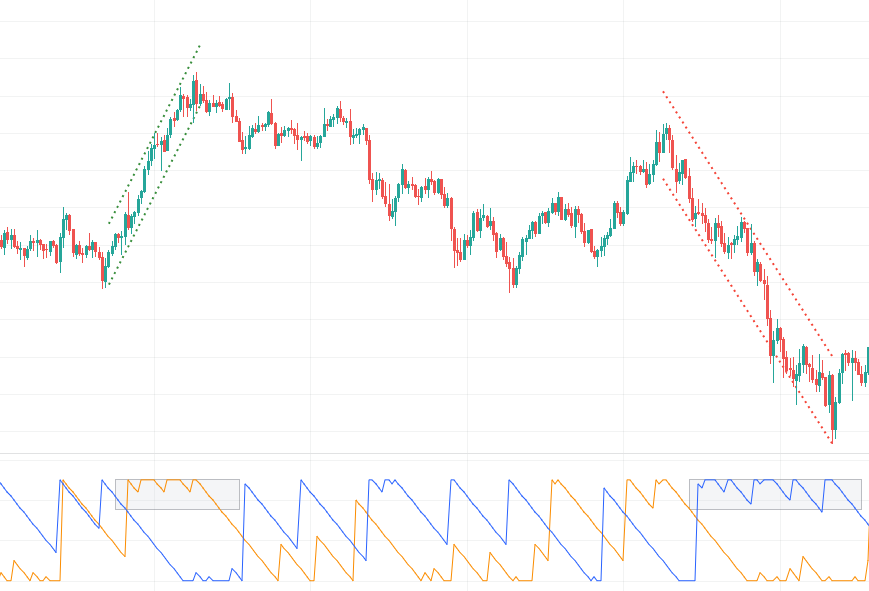
Weakness of the trend.
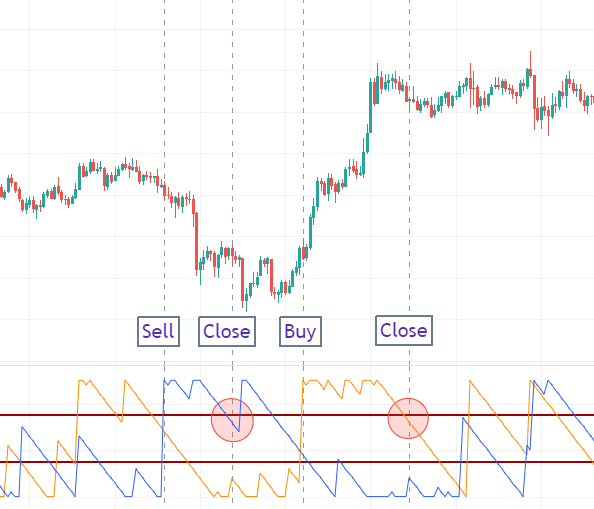
Every trader who opens a position on a signal from the crossover of the Aroon indicator lines asks the question: When to exit the position? This time we also need a 70% line.
You can see that on each stable trend, the values of Up or Down lines are kept at about 100%, but sooner or later one of these lines begins to fall. It means that the trend has begun to fade away and new highs are not formed anymore.
We may use the 70% line as a litmus test. Its crossover can be interpreted as a signal to exit a trade.
Setting the indicator
By default, the value N (the number of periods that is taken into account) is 14. This means that the indicator tracks high and low prices only in 14 candles.
For example, if after the formation of one top on the price chart, a new top has not been formed in 7 candles, then the Aroon Up line will show a decrease from 100% to 50%. And then, after another 7 candles, the Aroon Up line will drop to 0%.
In this regard, it makes sense to increase the value of N to 25 in order to decrease the sensitivity of the indicator. In this case, Aroon indicator will measure the time between peaks or lows within 25 candles. It will take more time for it to drop to zero and it will give fewer signals, but at the same time they will be more reliable.
In general, the deeper and longer rollbacks occur in any trend movement, the less sensitivity it requires.
Pros.
- The indicator is very easy to understand and use and it does not require significant adjustments.
- We can use it in any trading strategy aimed at following the trend.
Cons.
- Unfortunately, it is a lagging indicator. A trader should also use signals from price action strategies, as signals from Aroon alone may appear too late to open a position.
- Not applicable in flat. Aroon indicator does not take into account volatility and the magnitude of price changes. It only takes into account the number of days between highs and lows. Being in a flat, the indicator lines will cross sooner or later, because eventually the price will reach new highs and lows at least once within 25 periods.
Conclusion
Aroon indicator is an interesting signal tool. However, like all other indicators, it should be used in conjunction with trade signals from other elements of technical analysis, such as graphic patterns, wave analysis, signals from other technical indicators, etc.
Aroon indicator is not very well known among traders. So our team uses this oscillator very rarely and prefers to replace it with RSI or MACD, as a worthy alternative.