Perhaps you’ve heard of thousands effective trading indicators or patterns: flags, double bottoms, moving average convergence divergence, etc. And probably some of you use them with profit. But today we going to dive into the basics of candlesticks – engulfing candles. This pattern will help you pay more attention to candles, so you could make the right decision in any controversial situation.
- What is an Engulfing Candle Pattern?
- How to identify the Engulfing candlestick pattern?
- Who controls the market behind Engulfing Candle?
- Detecting Engulfing Candles patterns
- Bullish patterns
- Bearish patterns
- 4-hour and Daily Crypto Strategy
- What are the advantages of using Engulfing Candle?
- What are the disadvantages of using Engulfing Candle?
- Conclusion
What is an Engulfing Candle Pattern?
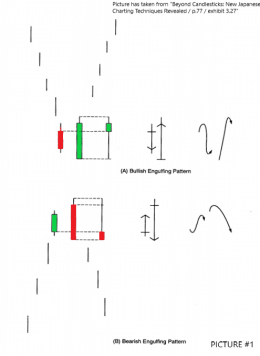
Engulfing candles is a two candlestick pattern – bullish and bearish (shown in pic #1). The basic definition is that the second candlestick must engulf a full body of the opposite-colored candlestick. That’s all. It’s quite easy, right?
What is a bullish engulfing pattern?
The bullish engulfing pattern takes its place in a downtrend when a green candlestick covers the full size of the red candlestick (pic #1 A). Please note that we do not count shadows.
What is a bearish engulfing pattern?
As you may have already guessed, the bearish engulfing pattern has the same principle – it occurs when the red bar wraps the green one (pic #1 B).
How to identify the Engulfing candlestick pattern?
First of all, we need to learn how to distinguish engulfing candles between random pairs with big and small bars. Here we just share 3 main principles for detecting engulfing candlestick patterns:
- The market must be in a clearly definable trend, even if it is a short-term one.
- The engulfing candlesticks contain only two candlesticks. The second candle’s body must engulf the body of the previous candlestick (we don’t count shadows).
- These candles should be opposite colors (green/red). (The exception is when the first candle’s body is very small or it’s a Doji. In this way, after an extended downtrend, a small green candle is engulfed by a very large green candle, which indicates that it could be a bottom reversal. In an uptrend, the opposite situation could be a bearish reversal pattern).
Who controls the market behind Engulfing Candle?
The engulfing candlesticks visually show us how forces of bulls or bears receive domination on the market.
Bullish Pattern
As an instance, bullish pattern appears when the bulls ripped out control of the market from the bears. In picture #1 (A) bullish engulfing pattern shows us how bulls in a support area counterattack and push the next trading session upwards. The bull’s power is greater because the open of the green candle is above the top of the previous red body.
Also, it’s very important to check them near support or resistance areas. This typically gives more chances to see the reversal soon.
Bearish Pattern
The same concept can be used to examine the bearish engulfing pattern. It shows us how an advanced pressure of sales beats the bulls.
In picture #1 (B) we see how bears are capable of covering the previous green candle. It means that in this case, the pressure of supply became so great so they easily close the second candle beneath the previous green real body.
Detecting Engulfing Candles patterns
Here we share few tips that would increase your chances to detect soon reversal:
- It’s obvious, but we must mention it. The first-day candle shows you a tiny real body or Doji and the second day has a large opposite candle. This would reflect a dissipation of the preceding trend’s force and the growing power of a new move.
- The engulfing candlesticks appear after the long or very rapid move. Such moves increase the chance that potential buyers are already long. Consequently, there may be fewer offers of new longs. And sometimes rapid moves make the market overextended and vulnerable to profit-taking.
- The second candle has a huge volume. Beware, this could be a blow-off.
- The second candle engulfs more than one prior real body.
- Keep an eye on candles near support or resistance areas. Any proper engulfing pattern typically gives more chances to see the reversal soon.
Bullish patterns
1st Bullish engulfing example
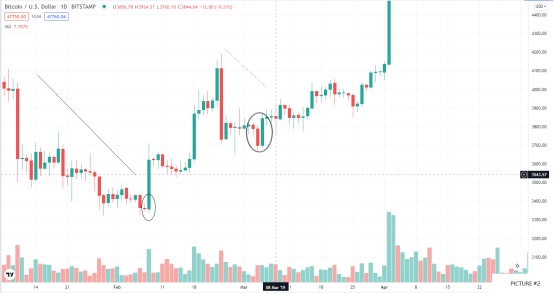
Let’s check OUR FYBIT BTC / USD chart. What do we see in the first example (picture #2)? We check the current trend – it’s a downward momentum. On the 7th of February, the price has come to the support area, a small body of red candlestick shows us that trader’s activity is squeezed in a small price range. Note the size of it, it’s close to Doji.
The next day demonstrates us enormous trading volume where bulls overwhelm the bears. This is a bullish engulfing pattern, which also appears as a trend reversal and subsequent upward momentum.
This is a nice example of how the previous red candle was engulfed in cryptocurrency market.
2nd Bullish engulfing example
In this example, we will see how engulfing pattern works in a short-term trend. In picture #2 we see that after reaching highs of 4000-4180 USD, BTC has a sharp correction which ends after touching new support area 3700-3660 with two bright Doji.
On the 4th of March, the mid-sized red candle has touched our support area again. What we see next is there’s a reversal large candlestick engulfs red mid-size candle. That would be a good deal for a trader who was looking for an entry point, after a correction from 4180 USD level. The correction has ended and here must open only long positions.
Don’t also forget about setting a stop-loss. By the way, it could be easily done on our platform. Just set the price below the support area and your trade is insured. The concept of risk management is very important in trading too. Before placing any order basing on any technical tool, always consider your risk management.
Bearish patterns
3rd bullish engulfing & bearish engulfing examples
When you consider engulfing candlesticks, pay attention to the relatively sized bars. An ideal bearish engulfing candle has a large red body covering a small green candle. The miniature size of the first body shows that the impulse of the previous rally is waning.
However, if there are two candles of nearly the same sizes which include the engulfing pattern, the market could enter the flat as opposed to a reversal. Allow me to demonstrate it in the next picture #3.
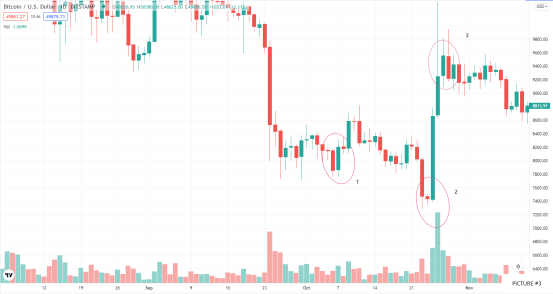
October ends the previous bearish run. Notice in the first example that the green candle and the red candle had approximately the same bodies. The truth is when they are roughly the same, it means that the bears and the bulls have roughly the same chances. Since there was no clear victory for the bulls over the bears, we should wait for flat. In addition, as we see later it’s not correct to set 7770 USD level as a new support area.
The second engulfing candle seems more successful, as we see at 7300-7400 level is forming the second bull engulfing candle. It’s a larger pattern with a tiny red body and a massive green body. It became looks like bears lose their strength, therefore it indicates that more likely it’s going to be a price reversal than turning sideways. Then this bullish engulfing pattern has become a support area and two candles reversal pattern. This long bullish candlestick tells traders to open the long trade.
The last example in 3rd picture shows how the bearish engulfing pattern occurs. This bearish pattern appears after rapid price action. As we mentioned if the pattern involves an equal last bearish candle and first bearish candle, it means that the subsequent trading period will be possibly a sideway.
4 Hour and Daily Crypto Strategy
Entry
How can we understand market sentiment and choose the best timing for long or short trade? Engulfing candlesticks in technical analysis will help us.
Engulfing candle strategy highlights good entries in the trend. Using the trend and the engulfing candlestick as trade trigger boosts your trading strategy’s efficiency. After one month of using it in your day trading strategy, you will upgrade your skill of reading candlestick charts and also will start to pay more attention to market reversal points.
We’re going to look for corrections/reversals to enter, assuming that after upward or downward pullback the trend will proceed and the next impulse wave in the trend direction will give us a nice profit.
The engulfing candlestick indicates to us that a pullback is over and the trend can resume. In the case of an uptrend, the bullish engulfing candle shows that the selling that occurs on a pullback is over and buying will resume. The trend does not always resume immediately or can be a trading trap, that fakes a reversal. That’s why when you suppose that certain up candle could be bullish engulfing, you should always play it save.
Stop-loss
When I play it safe, I mean the use of stop losses. It’s the same as your seat belt in a sports car. Just buckle it up while you are driving. When you use stop loss, you greatly reduce risk. Even if you are 100% sure of your technical analysis, do not forget to set stop loss. Profitable traders do it, so you should too. And if you are a beginner, it will help you not to lose money so quickly. In our case, we place the stop loss at least a few pips below the low for 4-hour or daily charts.
And even if you play it safe, sometimes losses can occur, and that’s okay, because we can not avoid them anyway. Professional traders can actively trade in such cases and take a small profit or a small loss. Or you can just let the price reach the stop.
Classic Exit
Sometimes the only way to make a lasting and stable profit is to add conservative trading methods to your trading strategies. That’s why we will use the classic exit here, based on your risk management.
Your reward should be in proportion to your risk, around 1.6:1 or 2:1, meaning that if you risk 10 pips, you should win 16-20 pips.
What are the advantages of using Engulfing Candle?
Like any trading tool, it has its own perks and few significant disadvantages. First, let’s talk about advantages:
- There’s no problem identifying it.
- Very simple rules to remember and follow.
- Working with large timeframes, such as daily gives you more precise data.
- Gives you an assessment of the current situation between bulls and bears.
- It’s a great option if you seeking profit by long or swing trades. Especially if you cannot sacrifice a lot of time, because of your day job.
What are the disadvantages of using Engulfing Candle?
Like any other technical tool, it won’t show 100% accuracy. Let’s briefly check them out:
- Small timeframes often fake reversal patterns. After engulfing candle follows short correction and then market proceeds trend’s line.
- There are also some difficulties in checking these candles without trend. If the market is stuck in the correction, better to not include engulfing patterns in your technical analysis for a while.
Conclusion
As you see engulfing patterns is a pretty useful trading tool. It helps you to find reversal points and stay away from trades in incomprehensible situations.
And note that, since crypto market shows high volatility, you should have more flexibility in defining engulfing candlesticks. Hope this article helped you a lot. Check engulfing candles and trade with a profit, good luck.