Here we are going to talk about volatility and one of the volatility indicators – Relative Volatility Index.
-High/low volatility – What does it mean?
-What does it show and what indicators can help me to measure it?
-How can I trade with this indicator?
If you do not know the answer to at least one of the questions – trust me, this article is for you. Also, we will discuss and analyze all its trading methods and strategies which could be applied to crypto market. If you are ready, let’s go.
Article contents:
- Definition
- Formula
- Buy & Sell trading signals
- RVI + Moving Average strategy
- RVI vs RSI
- How to access RVI on FYBIT?
- Summary
Definition
Volatility
Understanding the volatility gives you a full picture of how volatility technical indicators work. For the understanding of the Relative Volatility Index, it’s essential to realize what volatility is.
Volatility – is the standard deviation of the range and speed in the price of the trading asset.
Knowing volatility helps a lot in high turbulent periods. The volatility indicators are excellent technical tools that should boost your trading strategy and relative volatility indicator is one of them.
Relative Volatility Index indicator
The Relative Volatility Index or RVI is a volatility indicator. In 1993 Donald Dorsey developed this indicator. It’s not quite popular and hyped tool but some traders use it with enthusiasm.
The RVI works in an alike way as Relative Strength Index (RSI), the difference that RVI uses standard deviations (SDs) that are based on price direction instead of adding absolute price changes. RVI does not measure price movements, it is an excellent technical indicator for measuring market strength.
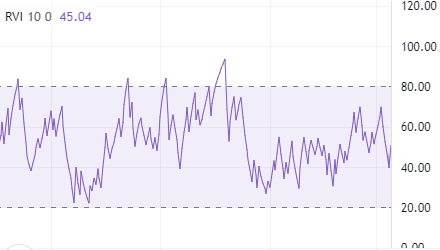
Classic RVI shows the range from 0 to 100, also there are versions with overbought/ oversold levels or with mid-line at 50.
Formula
The RVI indicator is calculated in a similar way to the RSI, but using the standard deviation (SD) of the high and low prices rather than the absolute price change:
RVI = [The average total of the SDs for positive days / ( The average total of the SDs for positive days + The average total of the SDs for negative days)] × 100.
Buy & Sell trading signals
RVI was not developed as a standalone indicator but as a confirming indicator. Here we will discuss popular confirming signals.
Classic
Here are the rules that Donald Dorsey developed as Buy & Sell trading signals for RVI:
- RVI > 50 is a potential buy signal
- RVI < 50 is a potential sell signal
- If you have missed the first RVI buy signal, buy when RVI values rise above 60
- If you have missed the first RVI sell signal, sell when RVI values fall below 40
- Close a long position when the RVI values are < 40
- Close a short position when the RVI values are > 60
Oversold & Overbought levels
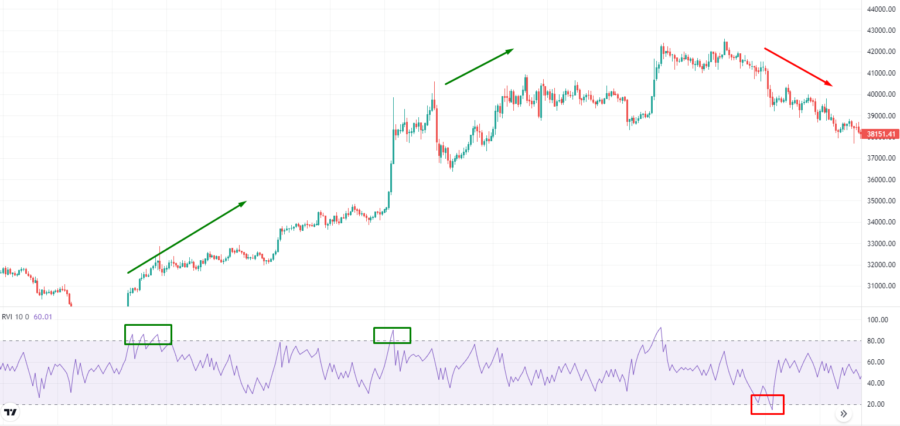
There is also another approach, that using 20 and 80 as overbought and oversold conditions. Some traders use 30 and 70 values for setting this confirmation indicator.
This means that the oversold level signals you about subsequent upside movement and the overbought level signals that the market will go downside (picture #2).
Note: use different timeframes to apply this method exactly to your trading style.
Divergence
A divergence is when the price of the coin is going up while the indicator is moving down, and the same vice versa.
Divergence can be used in many oscillators. If you have used it with other indicators, then it would be no problem applying it to RVI.
For instance, if you open a long trade – buy when the RVI goes up and keep holding your position even RVI has reached the overbought level.
The signal for closing your position will be when the RVI value is lower than the RVI value of the previous wave. Don’t forget, this divergence should occur while the price of the coin does not fall down (picture #3).
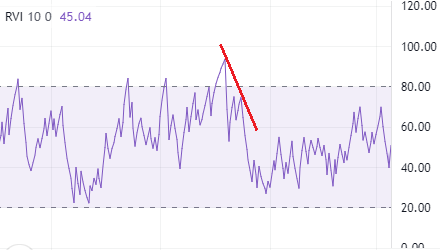
Practice shows that the impulse won’t stop when it has been reached overbought/ oversold levels. Inertia will keep the price on a certain level for some time.
RVI + Moving Average strategy
As we mentioned before, Relative Volatility Index is a good confirming indicator. In following trading method, it will confirm the trend and soon reverse.
As for the moving average, we are gonna use its crossover signal. It will show us potential entry signals.
Here just three main steps that we are gonna stick to:
- We wait until the past performance loses its power. The trigger of reversal to the opposite direction will be moving average crossover. It’s our potential entry.
- After we have opened a position, we wait for the new high/ low which is combined with a touch of overbought/ oversold levels. It means that average gain led our impulse to the peak of volatility volumes.
- We need to close the position. Our sell signal would be the divergence of RVI indicator.
Example
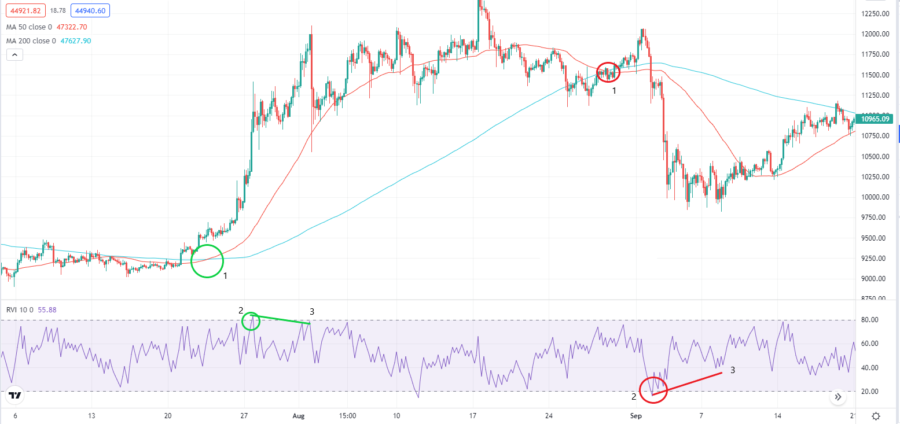
Let’s check how it works in BTC/USD chart. First of all, we should determine the direction of Bitcoin in this specified period. Moving average crossover will indicate that prior momentum has been finished. The green circle in picture #4 highlights a good entry for a long position.
Then just wait for a new price high in the chart and don’t forget about checking peaks of RVI which should touch (70/80) overbought level. Since now traders should keep an eye on the chart.
And finally, we should close our position. You can set the sell limit at closing price of the previous high/ close it while RVI divergence. If you trade short it works the same way. Look at the next example of short trading on the chart.
The red circle in the picture on the price chart indicates an entry for a short position.
After the moving average crossover, the price action increases, but the volatility shows a decline, which is a sign that we should hold a position and raise our stop losses at the previous price high.
After the reversal and the strong downward movement, we are waiting for the RVI to reach the oversold level.
The last step is to close the short position on a bullish divergence.
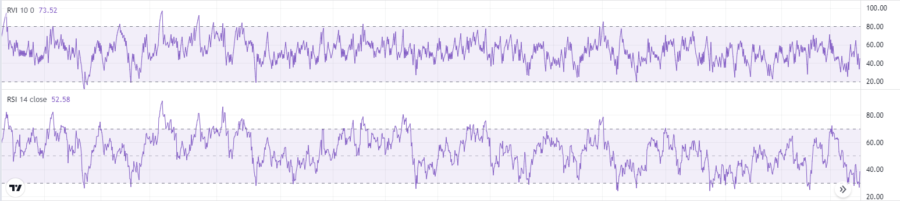
RVI vs RSI
The same as the Relative Strength Index, you can use the RVI to identify divergence in volatility of the coin. As we mentioned before, divergence is when the price of an asset is rising while the indicator is moving in the opposite trend.
Another good practical method is using the RVI with other volume indicators, momentum, or trend trading tools. Such combination is important because it helps to eliminate the possibility of losing a false breakout.
How to access RVI on FYBIT?
In order to access the Relative Volatility Index (RVI) go to our main page.
Click the “Indicators” tab and enter “RVI” or “Relative Volatility Index”.

Summary
The Relative Volatility Index is a simple but efficient indicator that measures the rise and fall of volatility. Some of the traders successfully use this index in crypto market.
Also, note that Relative Volatility Index can provide the wrong signals. That’s why you shouldn’t forget about stop losses and risk management.
Hope this article helped you a lot. Check Relative Volatility Index and trade with profit, good luck.