Volume profile indicator
Volume analysis is very important, as it is inextricably linked with the analysis of the price chart itself. From the price chart, we see where the price moves, and from the volume indicator, we can understand how many trades were made between sellers and buyers during these movements.
What is a volume profile?
The volume profile is a histogram that displays the total volume of concluded transactions in a certain time period or at a certain price.
In general, there are many variations of this indicator, but they are all divided into 2 types: vertical and horizontal. At first, we will talk about vertical volume or just about volume chart.
Vertical volume profile indicator (volume chart).
A vertical profile is a bar chart that is typically located at the bottom of a graph. The height of the bars on the histogram is directly proportional to the total volume traded in the market. The higher the bars, the greater the volume of the asset sold by sellers and, accordingly, bought by buyers.
The color of the bar is different, but usually depends on the color of candlesticks – bullish or bearish.
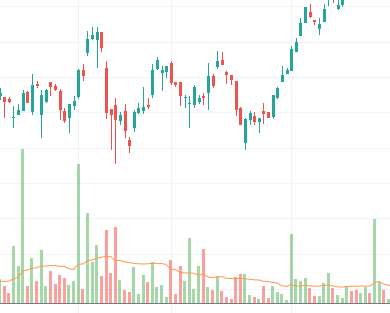
Many novice traders think that the red color of the column indicates that sales predominated among all deals, and purchases prevailed in green. However, this common opinion is absurd. Each of your purchases in the market at the same time is the sale of another person. And any sale is a purchase of another. Therefore, each column (no matter what color) has an equal number of purchases and sales. This means that it is impossible to determine whether the volume is bullish or bearish by the color of the bar.
And if the color of the bar gives us nothing but a deceptive sense of the direction of the force of movement, then feel free to change the color of the histogram columns to whatever you like, but choose only one color. So that your eyes do not mislead you and that you need to analyze the picture of the volume as a whole.
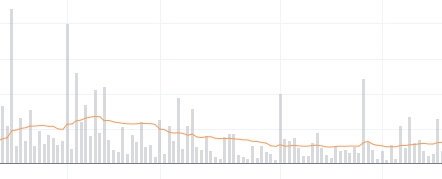
It is also good advice to add a moving average to the histogram if it is not enabled by default. We will talk about its use further.
Analysis of volume chart.
The vertical volume is inherently much more difficult to understand and interpret by the average person than the horizontal one.
Its interpretation requires a certain understanding of market processes and the rules by which the market moves.
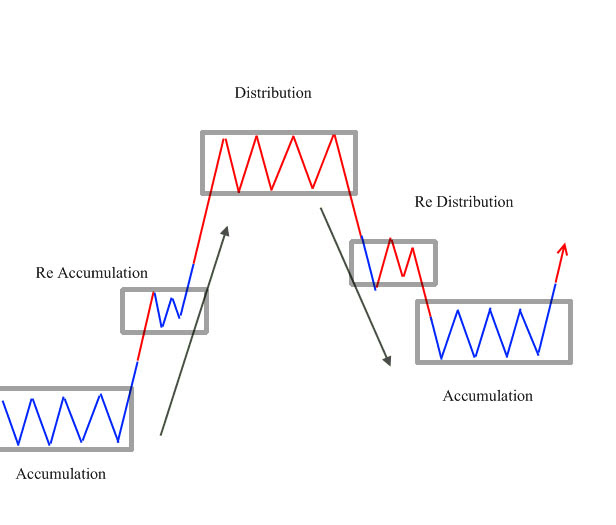
First, you need to learn how to determine the market phase on the chart in which you need to apply the analysis. In short, there are phases of accumulation and distribution. It is also necessary to take into account support and resistance levels, signals from chart patterns and other elements of technical analysis.
Now I will explain what I mean.
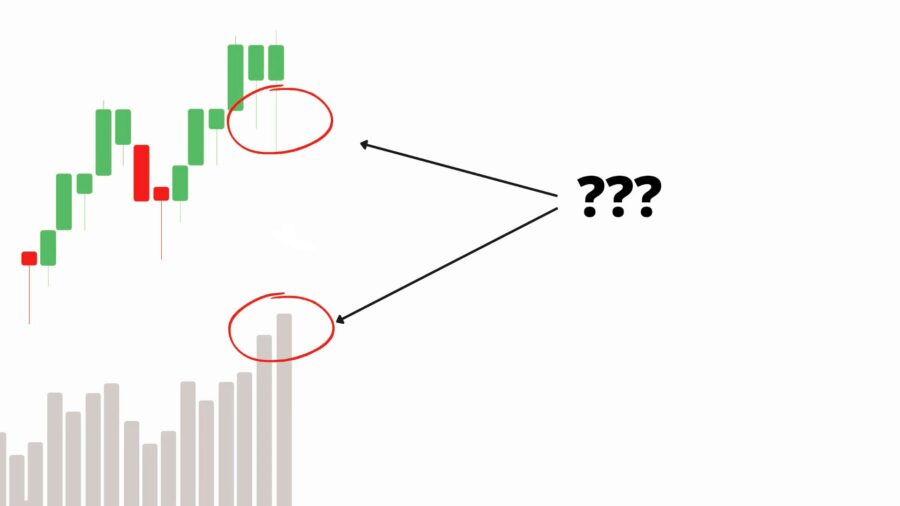
In this example, both price and volume show positive dynamics. The last two candlesticks have deep shadows and are trading at an increased volume, so how can this be interpreted? Are buyers buying or is there a significant offer pushing the price down?
This fragment of the graph can be interpreted in different ways depending on the overall picture.
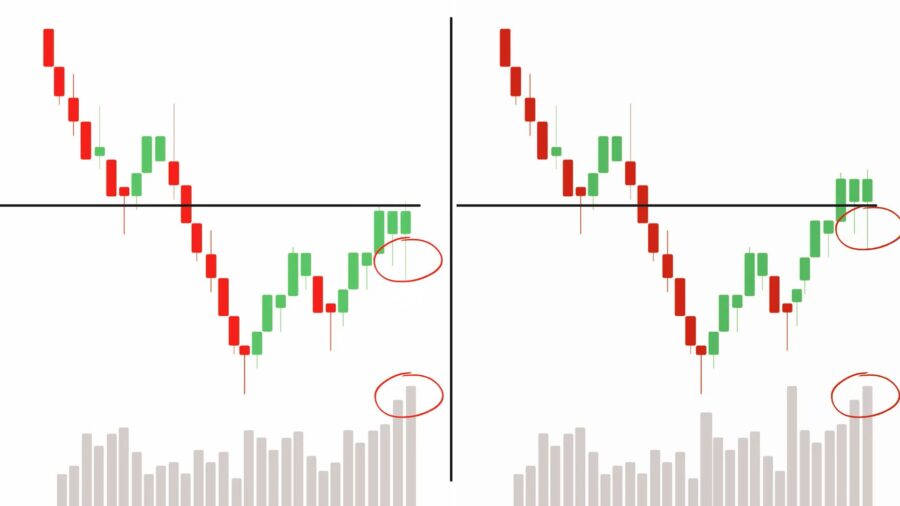
In the first scenario, we have a downtrend, a rollback, and when rising to a level, increased volumes appear, and the price repels from this level. Obviously not the most bullish situation.
The second picture shows the same candles, but the price managed to break through the support level, and it turns out that the level was broken with increased volumes. And every time the price went lower, buyers returned it back. The same candlestick pattern, but with a different context, can be interpreted in different ways.
Volume data cannot be viewed separately from context.
In the example we have considered, we conventionally depicted a support and resistance line. This line can be the border of a triangle, the neckline of the head and shoulders pattern, or maybe even one of the trend lines, there are many options.
Volume analysis can be used to check the validity of technical analysis patterns. Using volume analysis, you can try to distinguish between a true breakout of a border or level from a false one, thereby making a conclusion about whether the pattern is activated or not.
Consider the following example.
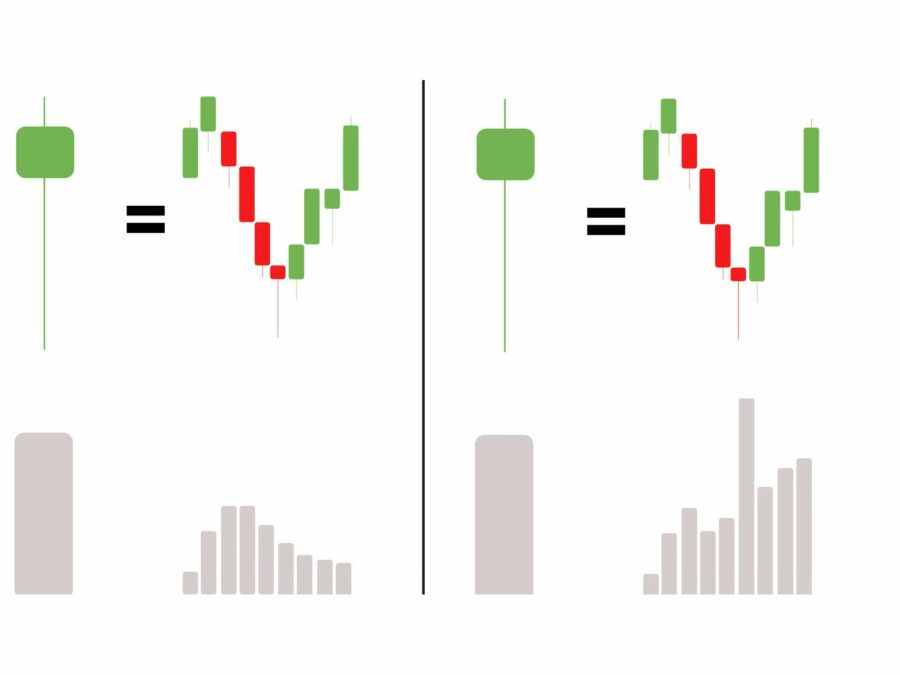
These figures show the same candlestick (let’s say something similar to the morning star) and our presentiment tells us that it is bullish, and the books tell us that it is generally positive. The fall was bought back, so we should expect growth, is it so?
Let’s take a closer look at the situation, breaking it down into 10 smaller candles. In the first example, the maximum volume is at 3,4,5 candlesticks (red), the buyback occurs at a low volume, and further growth at an even lower volume.
In the second example, the buyback occurs on an increased volume, and further growth on a larger volume than the previous fall. So in which of these two cases is the candlestick really reversal and the buyout took place? That’s right, in the second one.
What should a beginner do?
How to analyze volume if you are a beginner? To make it easier to perceive the volume, you can understand it as interest.
Volume is visible on bullish candles, which means that buyers have interest, and the price is likely to continue to rise. If the volume is visible on bearish candles, and volumes on bullish candles are low, it means that interest among sellers prevails, and a further decline is likely.
If the price rises, but the volume decreases, then the interest to grow further also decreases and there will soon be a fall.
The horizontal volume profile
What is Volume profile?
The horizontal volume profile displays the volume of trades executed at a specific price during the specified time period. This indicator has the same principle of operation as the usual vertical volume. The only difference is that the well-known vertical volume indicator shows the volume of deals at some point in time, while the horizontal volume indicator takes the price level as the main parameter.
VPVR (volume profile visible range) is the basic volume profile tool. It is a volume based indicator, which you can find in every trading terminal all over the world. The indicator shows most traded prices, which is the key component of many trading strategies.
Volume profile indicator consists of:
- Volume histogram
- Point of Control (POC)
- Developing Point Of Control
- Developing Value Area (VA)
- Boundaries of the value area (VAH, VAL)
The histogram reflects the trading volume and usually divides it into 2 colors. The color is determined based on the price movement inside the candles.
If the close of the candle is higher or equal to the open of the candle, then volume profile bars will be colored as “UP volume”, if the close of the candle is lower than open, then the volume will be colored as “DOWN volume”.
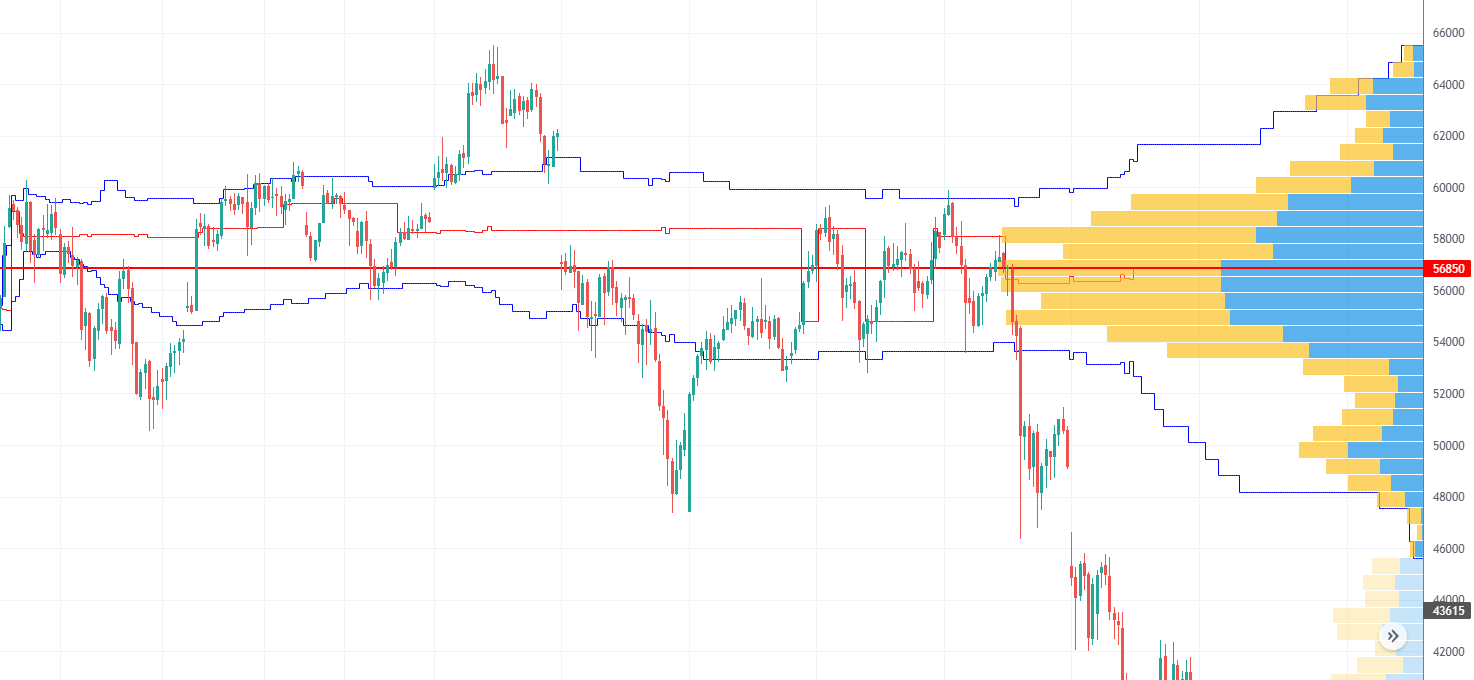
The longer the indicator strips are, the more deals were made at that price level. The longest strip is highlighted with a bold red line and is called the Point of control.
POC level
Point of control – the price level at which the most volume was traded for the specified time period that is visible within the boundaries of the screen.
To calculate the traded volume amount, the indicator takes data from the visible area on the screen. When we add new candles to the chart, the lengths of the indicator bars changes, and possibly the POC will also shift.
POC is a price level that most satisfies buyers and sellers, it attracts the price like a magnet. Therefore, with a high probability, the price will return to the POC and test it.
The POC line must be taken into account in your trading, as it is a strong support and resistance level. However, it is necessary to make a reservation that the better the accumulation is, the more important the POC line is.
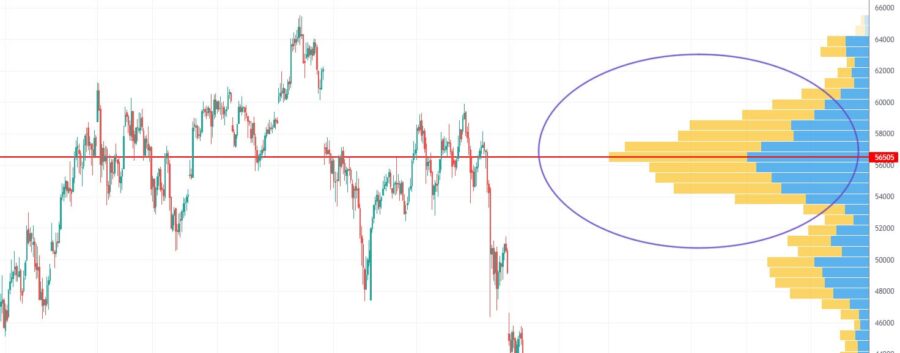
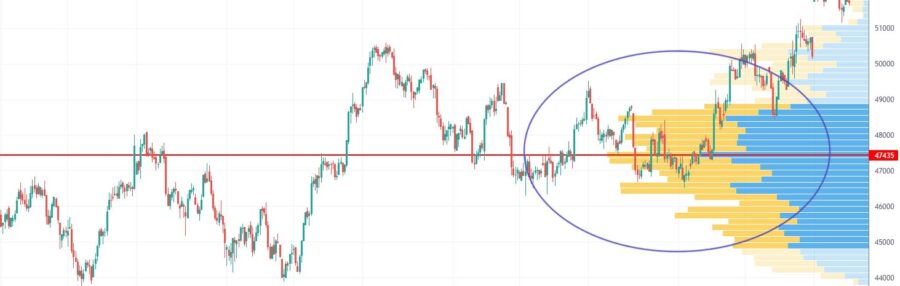
In the last example, we can see only the value area with the highest traded volume, but the indicator does not show us a clear level that we can use as support or resistance.
Setting the indicator.
If you increase the Number of Rows parameter, then the stripes will become narrower, but their number will increase. This is a useful setting that will increase the Range of Values and the point of control detailing.
You can then customize the visibility of the developing point of control (POC) and developing value area (VA).
Value Zone (VA) – The value area on a volume profile that contains most of the volume. Typically 70% of the trading activity is allocated in trading range.
Value Area High (VAH) – The highest price level within VA.
Value Area Low (VAL) – The lowest price level within VA.
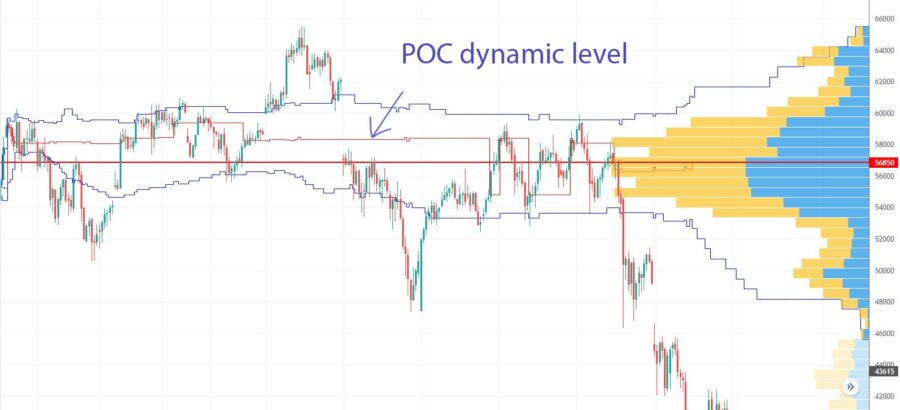
POC, VAH and VAL developing levels show how the indicator readings were earlier. Their readings are calculated from the data in the visible area of the screen.
Low volume node (LVN) – The zone with the lowest volume on the volume profile.
High volume node (HVN) – The zone with the highest volume on the volume profile.
How to use zones in trading?
In the first part of the article, we mentioned the terms accumulation and distribution. These are specified price levels (zones) in which large players either increase their positions or sell.
In the example below, using the volume profile indicator, we clearly see the accumulation and distribution zones. It is wise to place orders at these specific price levels.
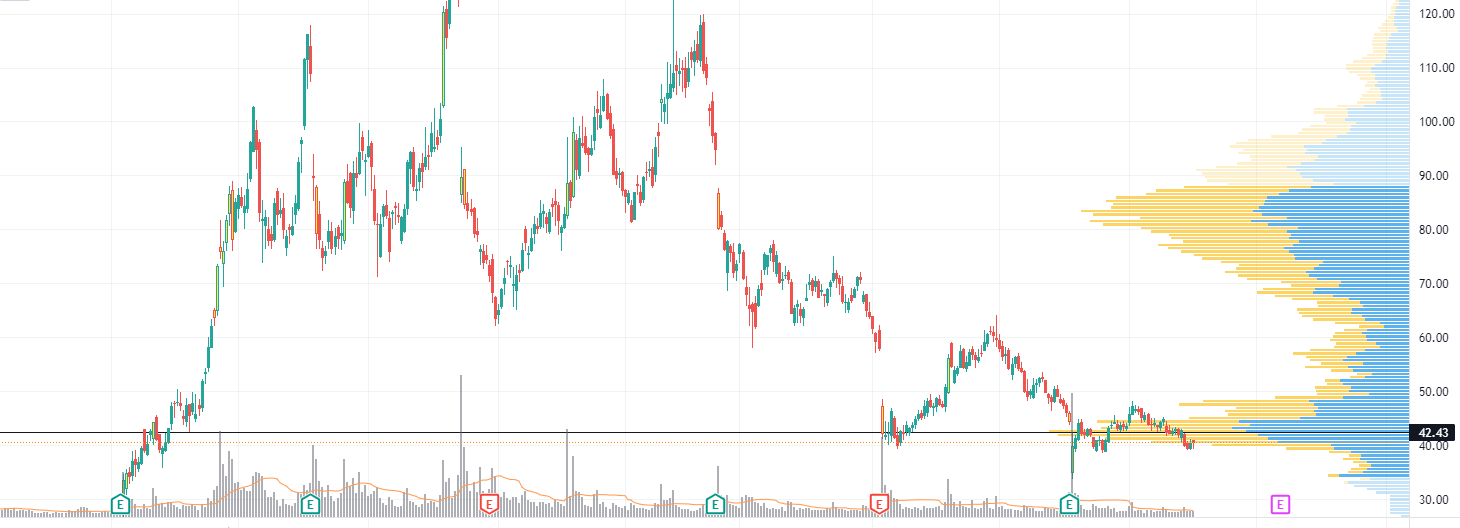
At the level of about $42, the position is being increased by large players. If the price holds in this zone, then the road to the next value zone is open for it, i.e. to about $83 per share, where we plan to sell it. In this example Volume Profile Indicator is a key component which is self-sufficient.
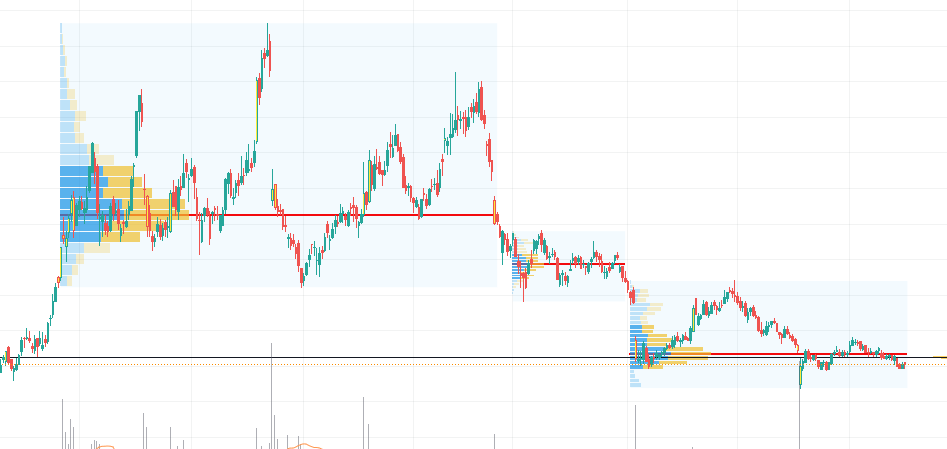
Fixed Range Volume Profile indicator
There are other volume profile indicators such as Fixed Range Volume Profile. It allows us to analyze the volume traded in any time interval we wish. You can also choose to display session volume for some accets.
Conclusion
- Horizontal volumes or volume profile is a special tool that helps to identify important horizontal price levels. With their help, you can find an entry point, set Stop Loss or Take Profit.
- Horizontal volumes are an auxiliary element that can be part of almost any trading technique. It is undesirable to work with horizontal signals without confirmation signals. In this case, you will receive a lot of false signals.