- Overview
- Calculation
- Strategies
- Advantages and disadvantages
- The Best Settings for HMA
- The bottom line
Overview
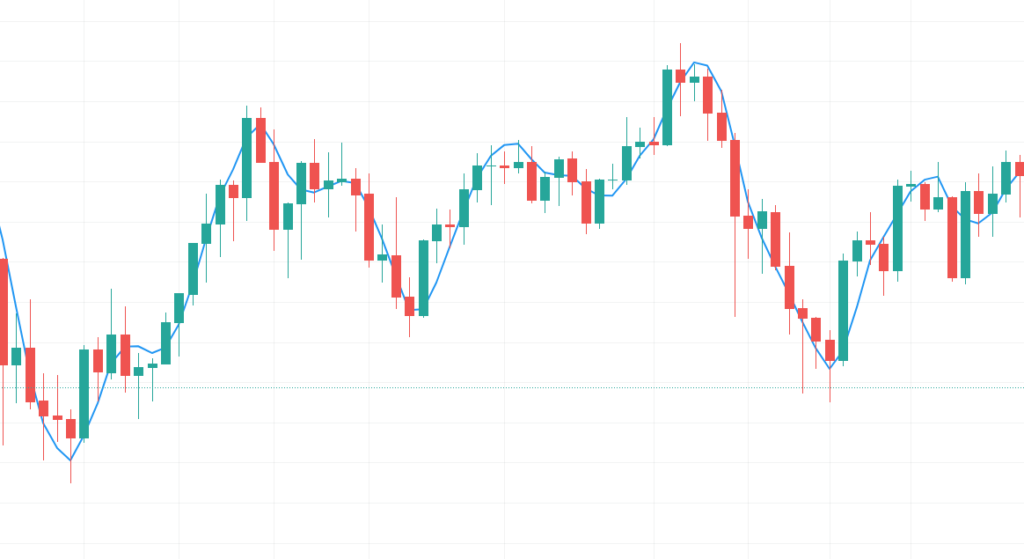
Hull Moving Average indicator is one of the technical analysis tools, which makes use of a WMA (Weighted Moving Average), highlights the latest prices compared to older ones. It allows you to map a smoother but quicker moving average that also you can use to pick out the current trend.
Next, we will discover how you may use it to make buy and sell decisions by this directional trend indicator. But first, let us find out the way it is calculated:
Calculation of Hull Moving Average
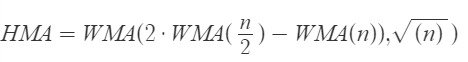
*Where n is the period of WMA
Hull Moving Average Strategies
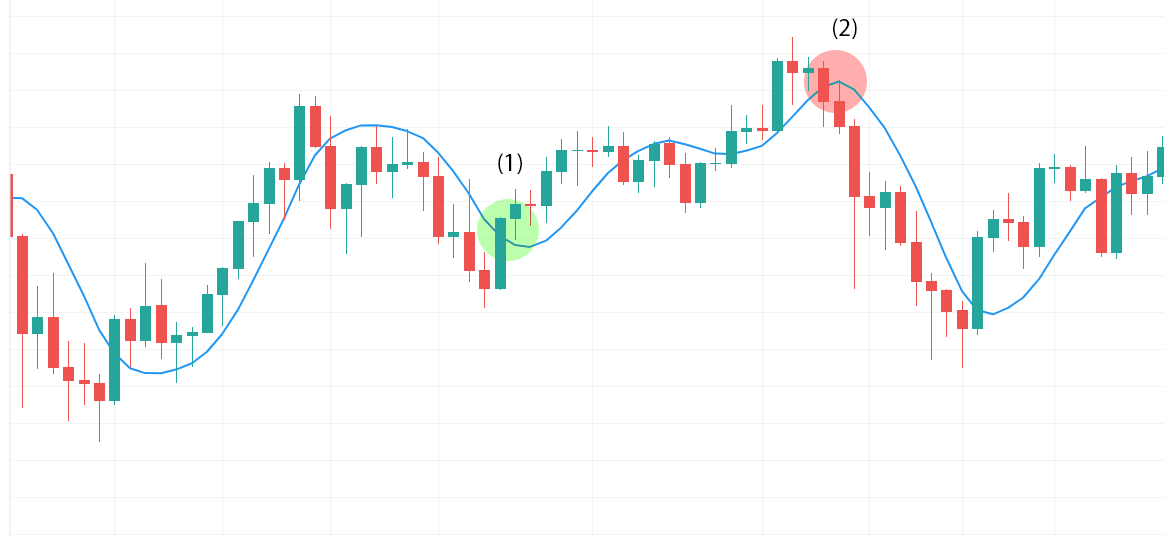
Turn to practical examples. As you may see in the chart below, a buy signal is when the price crosses the line from bottom to top (1). And a sell signal is when the price breaks from top to bottom (2). This definitely shows the change of a trend direction.
Hull Moving Average signals
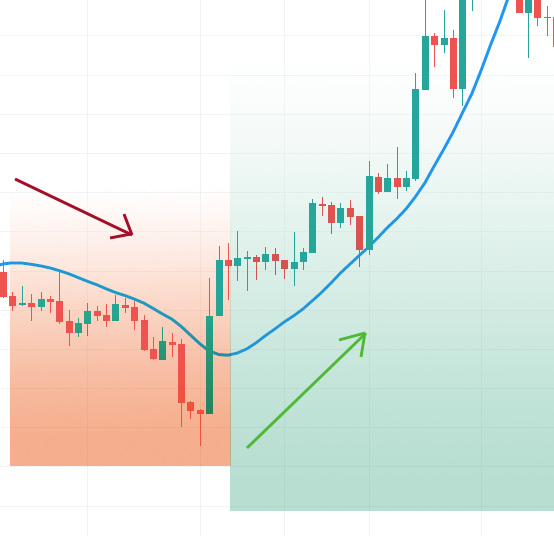
You also can simply use its directional alerts as entry and exit signals:
- There is a buy signal when Hull Moving Average turns upward;
- Conversely, signal to sell when Hull Moving Average turns down.
Hull Moving Averages indicator can be used on its own. You can without difficulty make a trading method based on HMA by including a few extra confirmation signals at the same time based on the trading style. The most popular approach in technical analysis for both entry and exit points is the crossover trading strategy. Indicator also can highlight significant levels that affect buying and selling decisions – potential support and resistance areas, in this case, you can use a pullback strategy. Let’s look at examples of such trading techniques.
Crossover Strategy
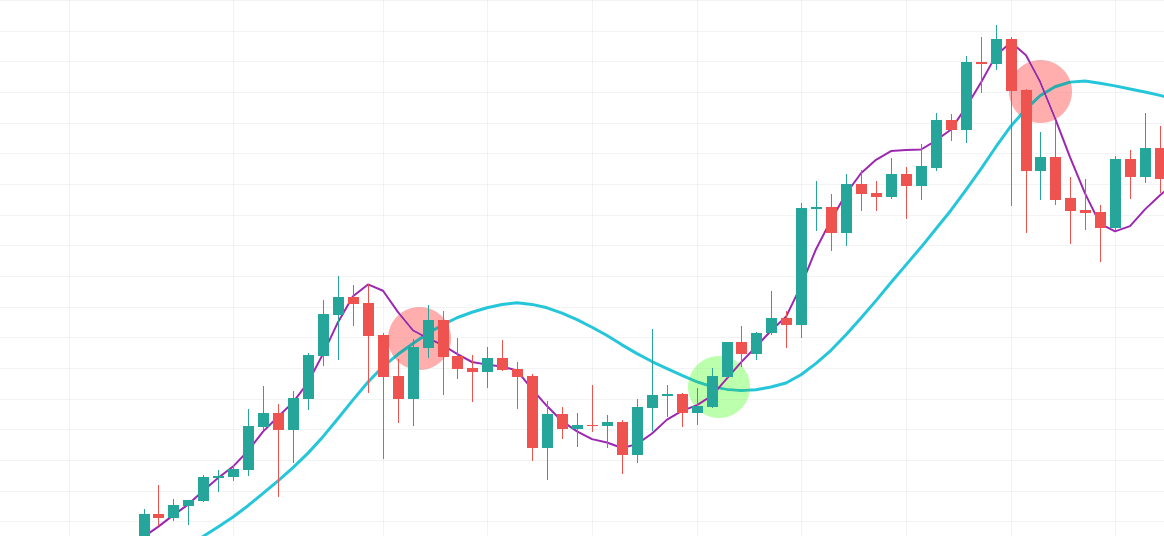
For this approach, insert two Hull Moving Averages with different length settings on the chart. Let’s set the indicator lengths to 15 and 50, which are purple and blue lines respectively on the chart above. The buy signal is when the faster HMA crosses over the slower one (In the chart you can see this case highlighted with a green circle) in the trend direction. Conversely, a sell signal is when the quicker Hull Moving average crosses the slower one from top to bottom (red circles in our example). Exactly the same way as with traditional moving averages.
Pullback strategy
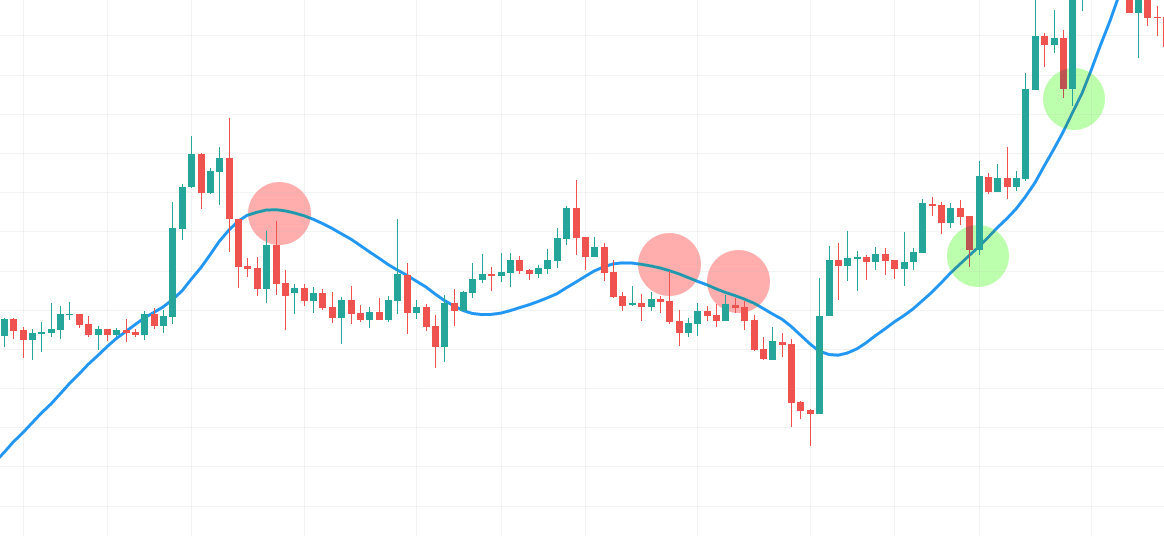
Trading this method, we must set HMA length to 55 at least, because it does not work with too short length settings. As you can see in the chart, a buy signal is when the asset’s price touches HMA’s line from above. On the chart, those situations are marked with green circles. The trend has bounced off the HMA’s line and has continued to move higher with excellent momentum.
If you go down to a lower time frame, you may get good results scalping bounces into pullbacks because the overriding trend continues to be going up. Conversely, a sell signal is when the price touches the HMA line from below (red circles). You also can integrate this method with candlestick patterns to verify the signals to get quality results. It’s worth mentioning the negative aspects of HMA with a purpose to keep away from trading surprises, particularly sudden changes in trend direction.
Combined strategy
To efficiently use HMA as a trend tool, it needs to go in combination with any other indicator, for example, oscillator including Average Directional Movement Index and Relative Strength Index or the most popular amongst these Moving Average Convergence Divergence (MACD), that is definitely a trend-following momentum indicator primarily based totally on MA and that shows the connection between moving averages of a crypto asset price.
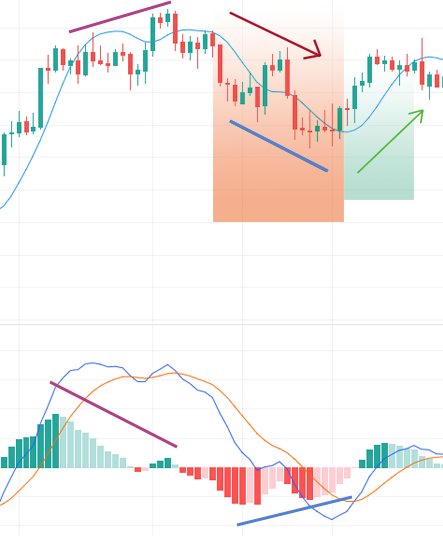
With this strategy, you can use the same HMA signals but most effective after confirmation by MACD. In the instance above the divergence became formed and after this, the trade signal by the HMA followed it.
Hull Moving Average indicator monitors the general trend and does it properly, plus it’s most effective as a trend reversal filter, so its alerts when closing a position are lots more accurate than its signals for entering. Note that HMA you can treat as a classic moving average at all, as it was calculated with the use of special logic. As a result, the crossing of the HMA line with different averages, according to Alan Hull, you cannot use as buying and selling signals.
Advantages
Hull Moving Averages allows to determine the current trend fast and clearly. Therefore, it is still appropriate for very inexperienced traders as a first indicator to look at and check their initial strategies. You can mix it well with different trading techniques and generates clean buy and sell alerts, however, they need extra confirmation for further trading decisions.
Disadvantages
The calculations of the indicator are based on historic records wherein the price has been, and in fact, you can not predict by it future price changes of a trading instrument.
One of the primary issues is that price actions can swing back and forth, growing multiple trend reversals or buying and selling signals with the too-rapid HMA. However, it has some advantages.
The best settings for Hull Moving Average
Just like the same old Moving Average, you can increase or lower the length of the HMA relying on your strategy. Play around with different MA lengths or time frames to see what works great for you.
Moving Averages by Alan Hull works for all periods, with first-rate results when the indicator has a length of 20+.
Also, for intermediate/medium-time period trading, it is recommended to increase the length of HMA (e.g. 55), then entry alerts will be displayed much less frequently, taking into account less market noise, which will increase the performance of a single trade. If your trading method involves a method of placing a protective stop-loss order, for example, you may try putting it below the WMA line (for a buy trade), or alternatively approximately 10-20 pips away from the entry price.
The bottom line
As we discovered, there are several applications of this indicator that you can use very effectively relying on your trading styles, you simply need to choose the most suitable settings. However, Alan Hull, who developed the indicator himself, recommends the use of it for directional signals and not for crossovers, which can be distorted by the delay.