- What does Historical Volatility mean?
- What is considered high volatility?
- How is Historical Volatility calculated?
- How else can Historical Volatility be measured?
- What is the difference between Historical Volatility and Implied volatility?
- How can we use Historical Volatility in trading?
- Trading Strategy
- The bottom line

What does Historical Volatility mean?
Briefly, Historical Volatility is the average range of fluctuations in the traded prices of a financial instrument over a specified period of time in the past.
Simply put, we can tell if a trading instrument’s price is generally highly volatile or not immediately after adding this indicator and studying its data.
Volatility is one measure of risk and the degree of price deviation from expected values. With the help of this indicator, you can evaluate the future behavior of assets. Despite the seeming difficulty of determining the practical use of volatility, trading on its basis is simpler in comparison with conservative models of crypto trading.
Understanding historical volatility
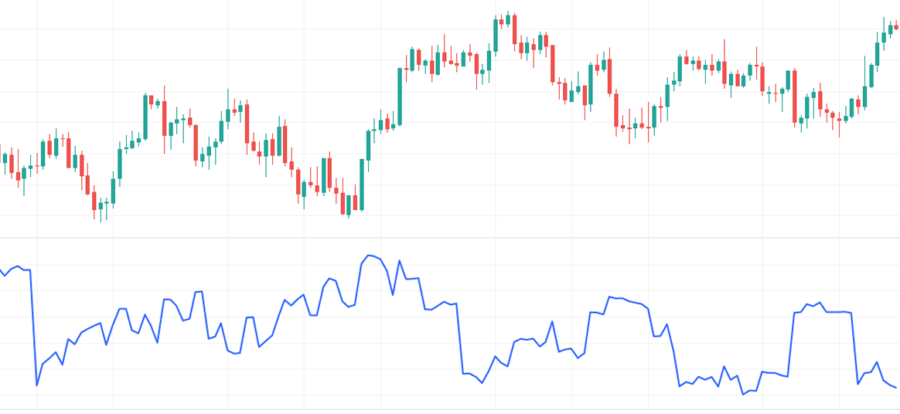
Here you can see how the indicator values change from low to high several times, which represents historic volatility.

Сomparing the indicator values with the price chart, you can see how the indicator displays changes in volatility, doing so with a slight delay.
How is Historical Volatility calculated?
The calculation of HV in several stages:
First, the price change for each period is calculated. The change in the price of cryptocurrency is calculated by subtracting the previous price from the latest price, then dividing by the previous price and multiplying by 100 as a result it is expressed as a percentage value.
However, to simplify the process of calculating daily volatility, automated systems use the standard deviation formula:
Rn = ln (Cn / Cn-1)
where:
ln – natural logarithm;
Cn – closing price;
Cn-1 – closing price of the previous day.
This step calculates the standard deviation.
The average return is calculated by summing the natural logarithms and dividing by the number of periods:
Ravg = (∑n i=1 Ri) / n
Then the square of the deviation from the average value for each price change is calculated:
(Ri-Ravg)2
After that, the average value of the squares of deviations is calculated by summing and dividing them by n-1 (21-1=20 at the time interval of 21 days). As a result, the formula for the variance of returns is obtained:
σ2= (∑n i=1 (Ri-Ravg)2)/n-1
To do this, we take the square root of the arithmetic average of the squares of the deviations of the variables from their average value. This result is called the standard deviation based on an unbiased estimate of the variance:
σ=√(∑n i=1 (Ri-Ravg)2)/n-1
The number obtained as a result of the calculation is one-day historical volatility. The index is expressed in percents (the result is multiplied by 100). Its high values indicate sharp fluctuations in the prices of financial instruments, while low values indicate their stability.
How else can Historical Volatility be measured?
- For example the standard deviation. It’s the most common way to measure cryptoasset volatility. You may add to it the Bollinger bands indicator for clarity.
- Its bars will properly illustrate the standard deviation right on the chart. Also, there is another tool – the Cboe Volatility Index, or VIX. It`s a real-time market index that represents the market’s expectations for volatility over the coming 30 days.
What is the difference between Historical Volatility and Implied Volatility?
Historical volatility is often compared to Implied volatility, which predicts the level of price volatility in the future. Implied volatility provides a forward-looking aspect of possible crypto-asset price fluctuations. Different time periods are used for comparison.
Traders consider statistical price volatility to determine expected volatility in a particular trading asset or index. Investors use this measure to assess the risk associated with purchasing securities. Assets with high volatility are characterized by a high degree of risk.
How can we use Historical Volatility in trading?
Unlike indicators such as the Moving Average and Relative Strength Index (RSI), the Historical volatility indicator does not give signals and does not indicate when to buy or sell a crypto active. Also, it can not determine the overbought and oversold levels. The indicator only measures high volatility or low volatility it was in the past.
That is, simply the indicator only shows what previously happened to the trading instrument and you cannot use it as a tool that helps to conclude about the next movement.
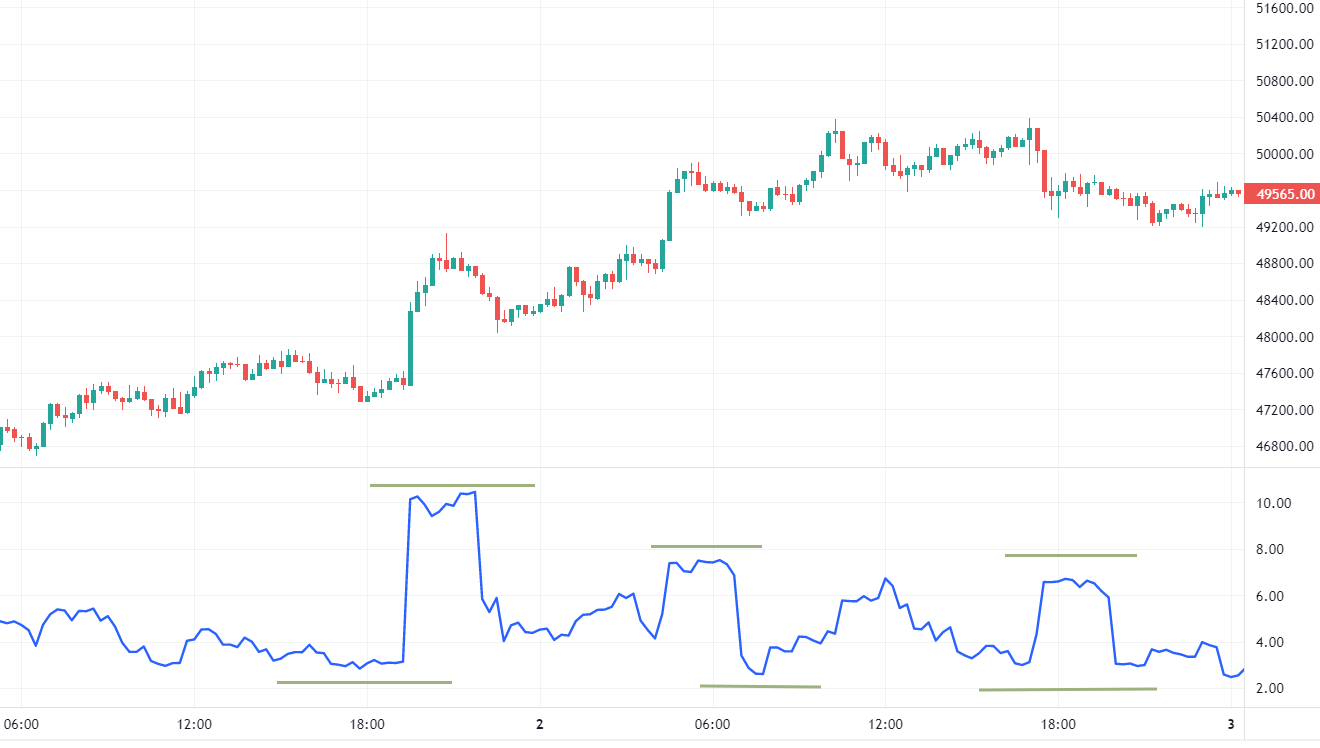
Historical volatility signals:

But nevertheless, you can use it for general estimation and behavior of crypto-asset for a specified period. For example, if HV rises, it means that a crypto currency becomes very volatile. Therefore, it may indicate a need for further research on what caused this activity.
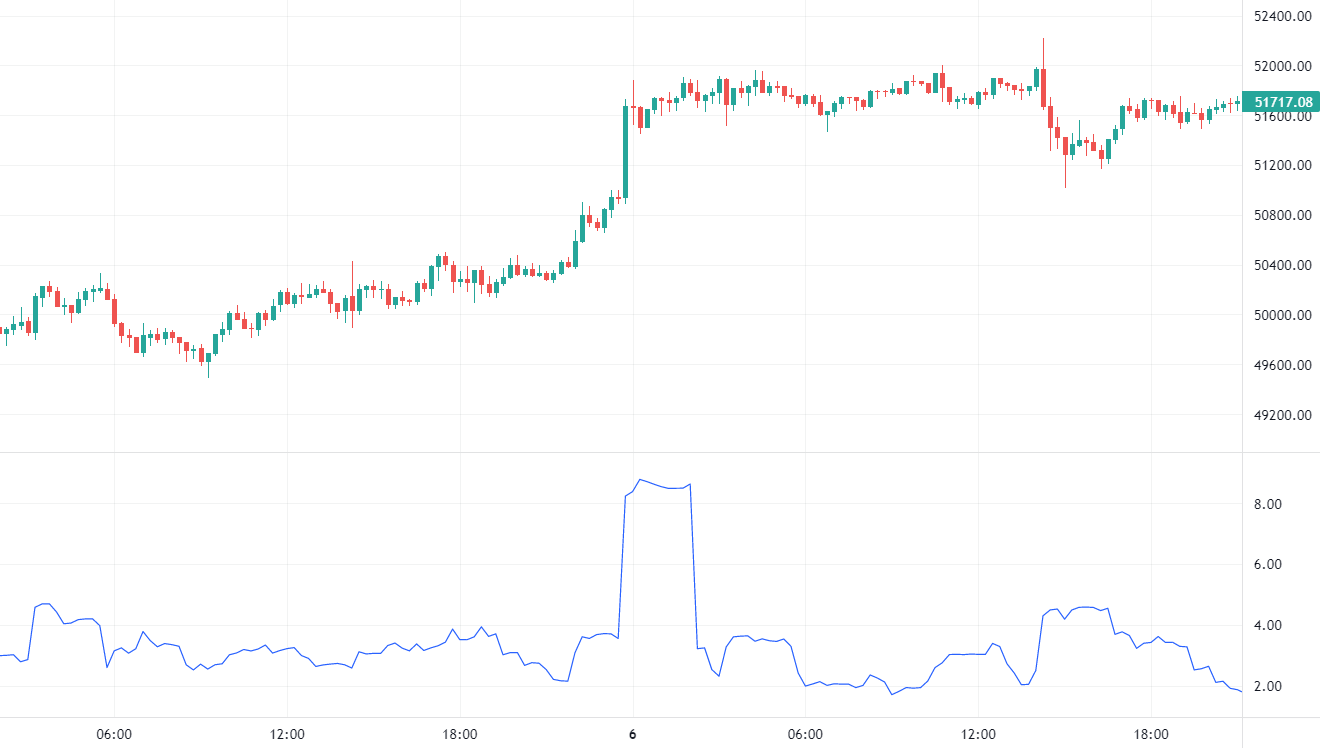
Here you can see how it changes from low volatility to higher historical volatility on the daily chart:

Since BTC/USD became highly volatile during a given period, add other indicators that help to found out the current trend.
And as a trader, you have to look deeper into the news background around the trading instrument and understand why this is happening. It is the main task of a trader to keep abreast of news about his crypto asset.
Historical volatility, on the other hand, can directly indicate a change in the fundamental data, but only after the fact.
By the way, you see directly from this indicator that price deviates with certain volatility as it was with Bollinger bands or any other indicators that use historic volatility with that distinction that now you do not even need to look at the chart of the instrument to determine its volatility level if there was uncertainty and measure the approximate volume of daily returns.
This is how traders in the past have chosen specific stock and include it in a portfolio in order to be able to accurately identify continuously compounded return.
Trading strategy
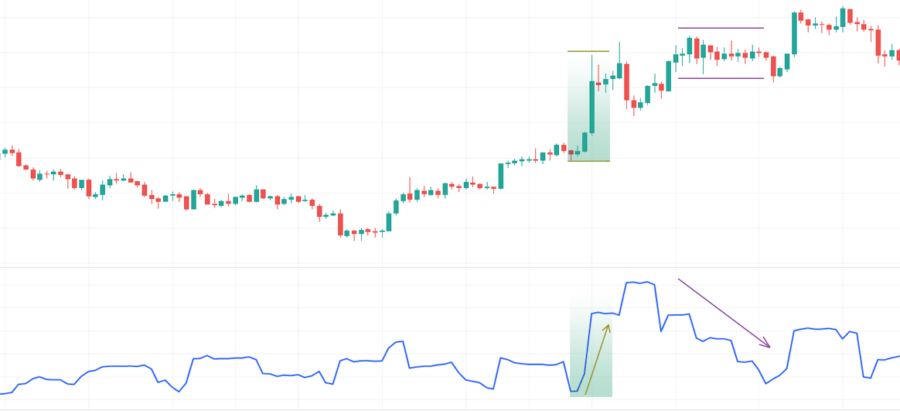
We can look at a simple example of a strategy by adding a simple Moving Average indicator. This indicator, which is good in strong trend movements, but totally useless in a flat, when the market price of a crypto-asset is at relative rest.
To create a profitable strategy in this case we need to filter the Moving Average signals, and to do so we need to apply the Historical Volatility indicator. It will allow us to determine which stage the market is at and to use a particular trading method accordingly.
As you know, trading in a flat market is not the same as in a directional trend move. It doesn’t depend on the time period and crypto asset. That’s why if you have a trend following strategy, you should try to avoid open positions when the market is in a flat phase as much as possible.
The bottom line
Generally, historical volatility is a statistical measure and inherently cannot predict future volatility and trading ranges even intraday, as its calculations are based on past performance. This means that in particular, you cannot say that there will be a certainly expected move.
However, it is a good statistical indicator for comparison with the performance of other financial instrument assets or the market index over a given period of time. You can use Historical Volatility in all types of risk valuations.
Despite that sometimes it displays clear signals for entry on the daily chart. Note that all the indicator points to are historical prices and their average deviation from these values.


