- The lead on-chain analyst for Glassnode recently shared that the sell-side risk ratio for BTC is at an all-time low.
- According to the analyst, BTC may experience a massive move up as selling pressure fizzles away.
- BTC’s price was trading at $26,750.13 at press time after printing a 2.36% loss over the past 24 hours.
The lead on-chain analyst for Glassnode, _Checkmate, shared in a tweet published this morning that the sell-side risk ratio for Bitcoin (BTC) is approaching all-time lows. In the post, he added that this indicates that investors are reluctant to spend coins which are both in profit or in a loss within the current price range.
The analyst added that this ratio usually reaches all-time lows when sellers are exhausted on both sides, which suggests that big moves may occur in the near future. This may be a much-needed short-term bullish sign for the crypto market, which saw its market cap drop 2.04% over the past 24 hours according to CoinMarketCap – taking the total to $1.12 trillion.
In terms of BTC, the leading crypto’s price stood at $26,750.13 at press time after it had printed a 2.36% loss over the last day. This recent negative performance also flipped its weekly price performance into the red. As a result, BTC’s price was down 0.77% over the past 7 days.
After reaching a daily high of $27,386.99, BTC’s price had recently broken below the key $27K mark to set a 24-hour low at $26,694.43. The market leader was not out of the woods yet, as its price was trading dangerously close to its daily low.
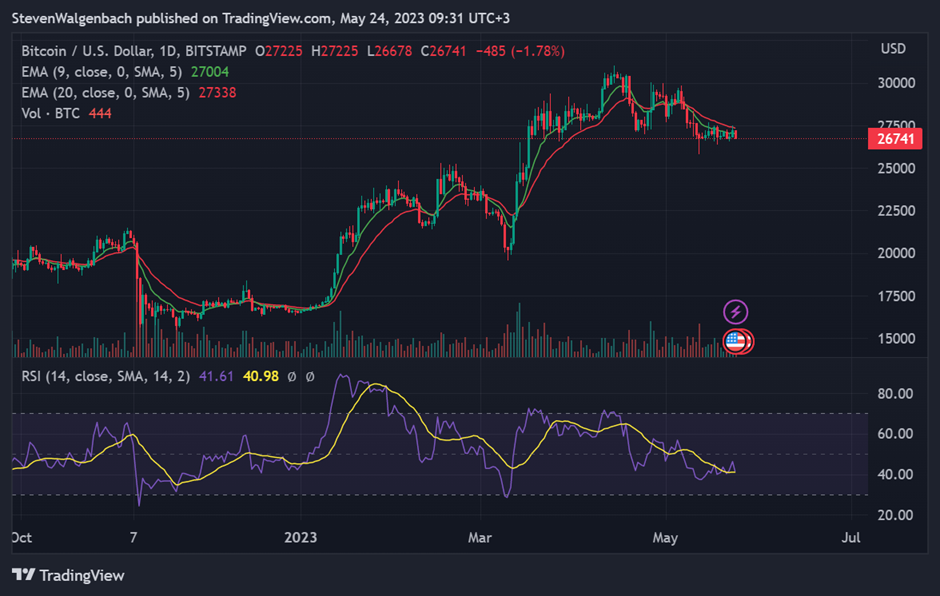
Technical indicators on BTC’s daily chart were bearish at press time, with the 9-day EMA line trading below the 20-day EMA line and the daily RSI line looking to cross bearishly below the daily RSI SMA line. If the daily RSI line crosses below the daily RSI SMA line in the next 48 hours, then BTC’s price could drop to $25,450 in the following days.
On the other hand, the daily RSI line remaining above the daily RSI SMA line for the next 48 hours will see BTC’s price attempt to break above the 9-day and 20-day EMA lines. Should this happen, BTC will climb to $28,200 in the next few days.
Source:coinedition.com