
On-chain data shows the number of Bitcoin loss addresses has shot up following the cryptocurrency’s dive toward $87,000.
Bitcoin Market Delivered Shock As Price Plummets 7% In Past Day
Bitcoin had already been following a bearish trajectory during this month, but it appears the asset’s decline has seen an acceleration in the last 24 hours as its price has dropped by more than 7%.
Below is a chart that shows how the coin’s crash has looked:
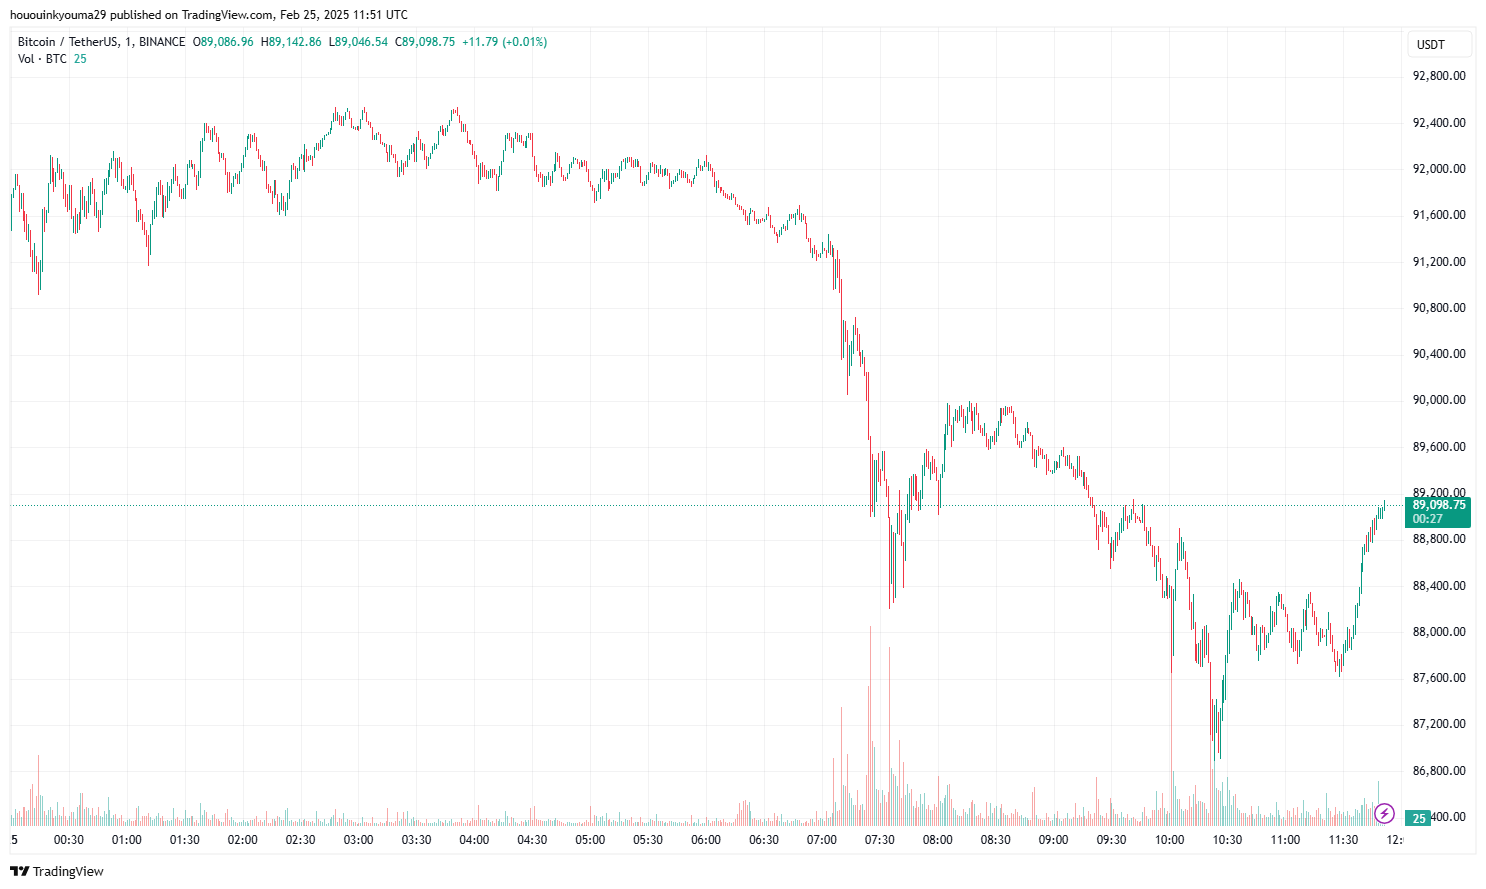
From the graph, it’s visible that BTC briefly dipped under the $87,000 mark during the plummet, but it would appear it has since found a small rebound back to $89,000. Bitcoin hasn’t been alone in this bearish price action, as the rest of the digital asset sector has taken a dive inside this window as well. Most of the altcoins have also in fact printed worse returns than BTC.
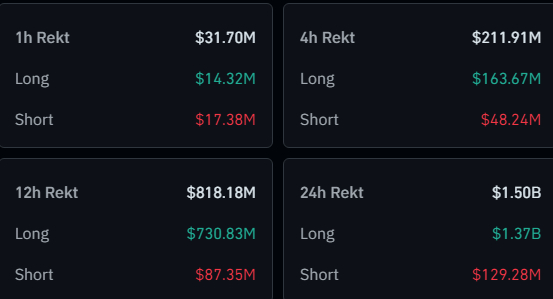
Severe liquidations have occurred over at the derivatives side of the sector as a result of this sector-wide drawdown, according to data from CoinGlass. In total, liquidations have reached a whopping $1.5 billion in the last 24 hours.
Naturally, a consequence of the crash was that BTC’s profit-loss distribution saw a notable change.
More Than 12% Of BTC Addresses Are Now Underwater
In a new post on X, the market intelligence platform IntoTheBlock has discussed about the latest trend in its Historical In/Out of the Money indicator. This metric basically tells us about the percentage breakdown of BTC addresses between profit, loss, and break-even.
The indicator works by going through the transaction history of each address on the network to see what average price it received its coins at. If this cost basis is greater than the current price, then the metric puts the address into the loss category, which the analytics firm terms as ‘out of the money.’
Similarly, holders of the opposite type fall into the profit category, or ‘in the money.’ The addresses that have an average acquisition price equal to the BTC spot value can be assumed to be just breaking even on their investment, or ‘at the money.’
Now, here is the chart for the indicator shared by IntoTheBlock, which specifically shows the trend in the Out of the Money portion of the Bitcoin userbase:
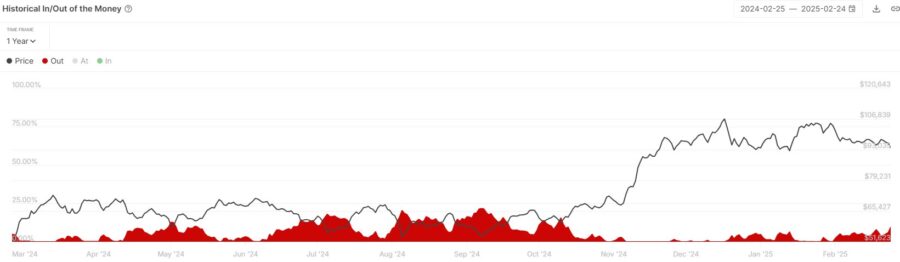
As displayed in the above graph, the metric has gone up alongside the latest crash in the BTC price, as a large amount of addresses have entered into a state of loss. In total, over 12% of the cryptocurrency’s holders are underwater now, which is the highest level since October of last year.
Source: newsbtc.com