
This Bitcoin price pattern could mislead Bitcoiners, according to legendary trader Peter Brandt

A seemingly bullish Bitcoin (BTC) pattern could end up being a trap, according to recent analysis offered by prominent chartist Peter Brandt. The largest cryptocurrency by market capitalization has now formed the inverse head-and-shoulders pattern on the daily chart, which is typically believed to be a sign of bullish reversal. However, there is a catch: The pattern that the Bitcoin price is currently developing has a downward-sloping neckline.
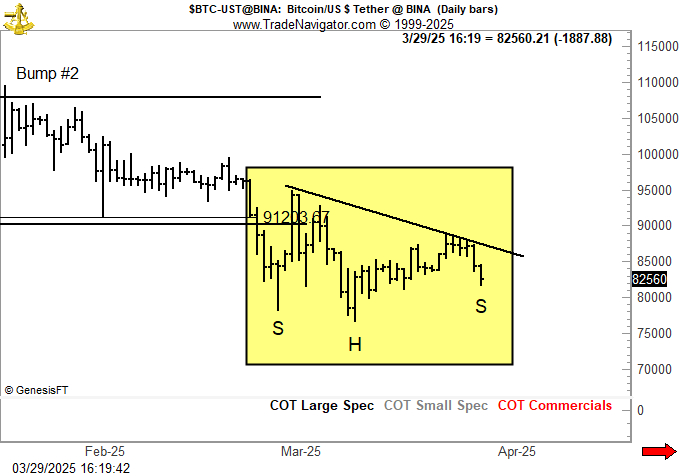
Brandt, who has more than four decades of experience as a commodity trader, says that he prefers H&S patterns with horizontal necklines since they are significantly more reliable.
The downward-sloping neckline means that the cryptocurrency’s bullish momentum is possibly waning due to the lack of aggressive buying. Hence, one should not rule out that any future breakout will end up being a fakeout, with the price plunging back below the neckline of the pattern.
Plunging back to $60,000?
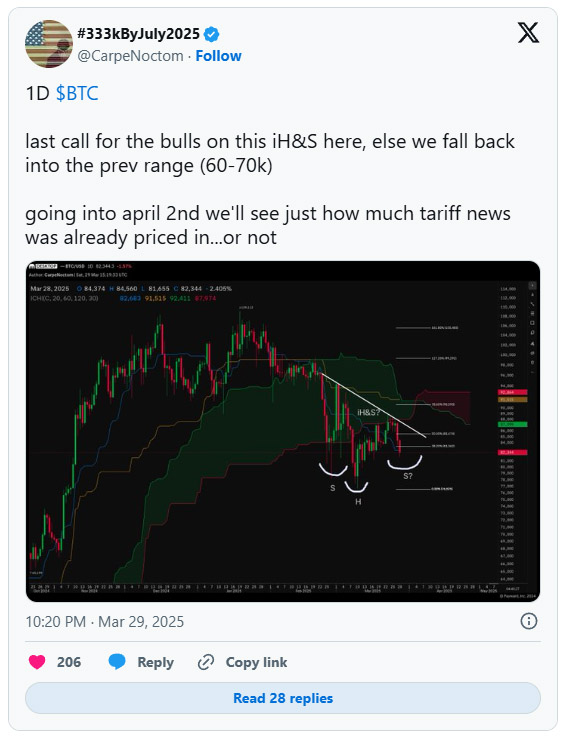
Prominent trader Josh Olszewicz has also taken note of the bullish pattern on the one-day chart in a recent social media post. He is seemingly convinced that this could be the last opportunity for the bulls to step up. Otherwise, Bitcoin could be at risk of collapsing back to the $60,000-$70,000 range.
According to data provided by CoinGecko, Bitcoin is currently trading at $83,091 after losing 0.7% over the past 24 hours. Earlier this Sunday, the cryptocurrency reached an intraday low of $81,769. The cryptocurrency is struggling to revive its bullish momentum, with global trade tensions putting extreme pressure on risk-on assets.
Source: u.today