
Bitcoin (BTC) continues to consolidate below $100,000, but technical indicators, alongside the asset’s relationship with Tether (USDT), could signal a new record-high path towards the $150,000 mark.
Specifically, analysis by prominent online trading expert TradingShot indicated that a key technical pattern involving USDT dominance and the U.S. Dollar Index (DXY) suggests a major rally could be on the horizon.
In a TradingView post on February 19, the expert stated that Bitcoin’s current price action resembles the re-accumulation phases observed during previous bullish legs since the November 2022 bottom.

These phases have historically preceded strong price surges, and the present market structure seems to be following a similar trajectory.
One of the most striking indicators comes from USDT dominance, which is forming a peaking one-day RSI structure that has historically preceded Bitcoin breakouts. Simultaneously, the U.S. Dollar Index is pulling back, a pattern that has fueled Bitcoin rallies.
Technically, Bitcoin is hovering near the 0.5 Fibonacci retracement level, a key support in past surges. If this holds, Fibonacci analysis suggests a breakout could push Bitcoin as high as $150,000, aligning with historical trends where Bitcoin surged after similar USDT dominance and DXY movements.
At the same time, Bitcoin’s relationship with Tether may soon impact the market. As reported by Finbold, Tether may need to sell part or all of its $8 billion Bitcoin holdings to comply with proposed U.S. stablecoin regulations. Currently, 44% and 17% of its reserves are non-compliant due to assets like Bitcoin, precious metals, and secured loans.
If Tether sells its Bitcoin holdings, it could lead to increased selling pressure, potentially driving Bitcoin’s price lower due to the sudden influx of supply.
Bitcoin targets reclaiming $100,000
It is worth noting that Bitcoin has recently lost momentum above the $100,000 zone, with the asset being impacted by several factors. For instance, recent uncertainty stemming from inflation and the anticipated Federal Reserve interest rate decision have weighed down the assets, as have ongoing trade wars.
However, most analysts’ long-term sentiment around Bitcoin remains intact, with the $100,000 spot as the key anchor for the next leg up.
In this line, pseudonymous cryptocurrency analyst El_crypto_prof analysis suggested that Bitcoin is testing the upper resistance of a falling wedge pattern, a historically bullish setup often preceding a breakout.
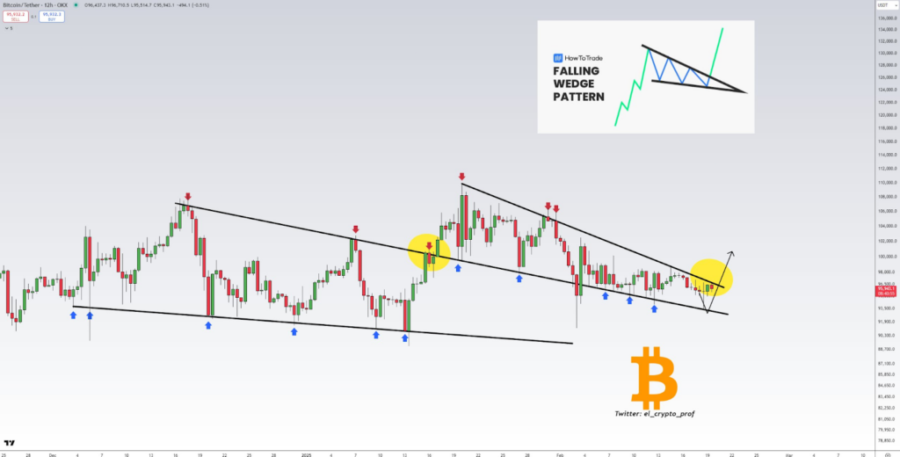
As things stand, BTC is forming lower highs and lower lows, with repeated support touches and resistance tests.
Currently trading around $95,000 support, the analyst stated that Bitcoin is positioned below the wedge’s resistance. A confirmed breakout could propel prices toward $100,000 at a time some experts foresee an extended surge to $107,000.
Bitcoin price analysis
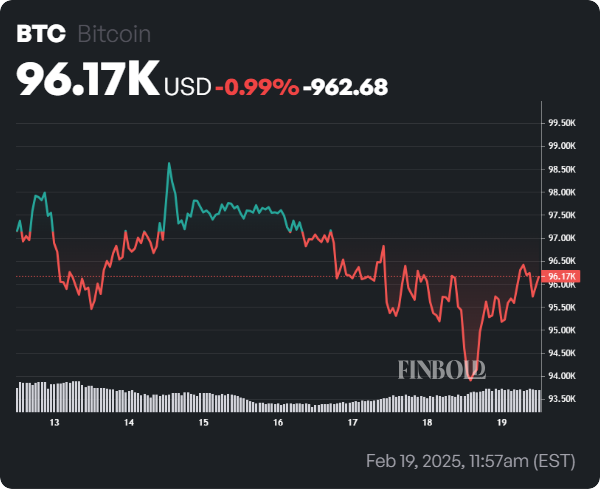
Bitcoin was trading at $96,170 by press time, having gained about 1.2% in the last 24 hours. On the weekly timeframe, BTC is down 0.9%.
For Bitcoin to resume upward momentum, the asset needs to clear short-term resistance levels. The current price is below the 50-day simple moving average (SMA) of $98,933 but well above the 200-day SMA ($80,638), indicating a long-term uptrend despite short-term weakness.
Source: finbold.com


