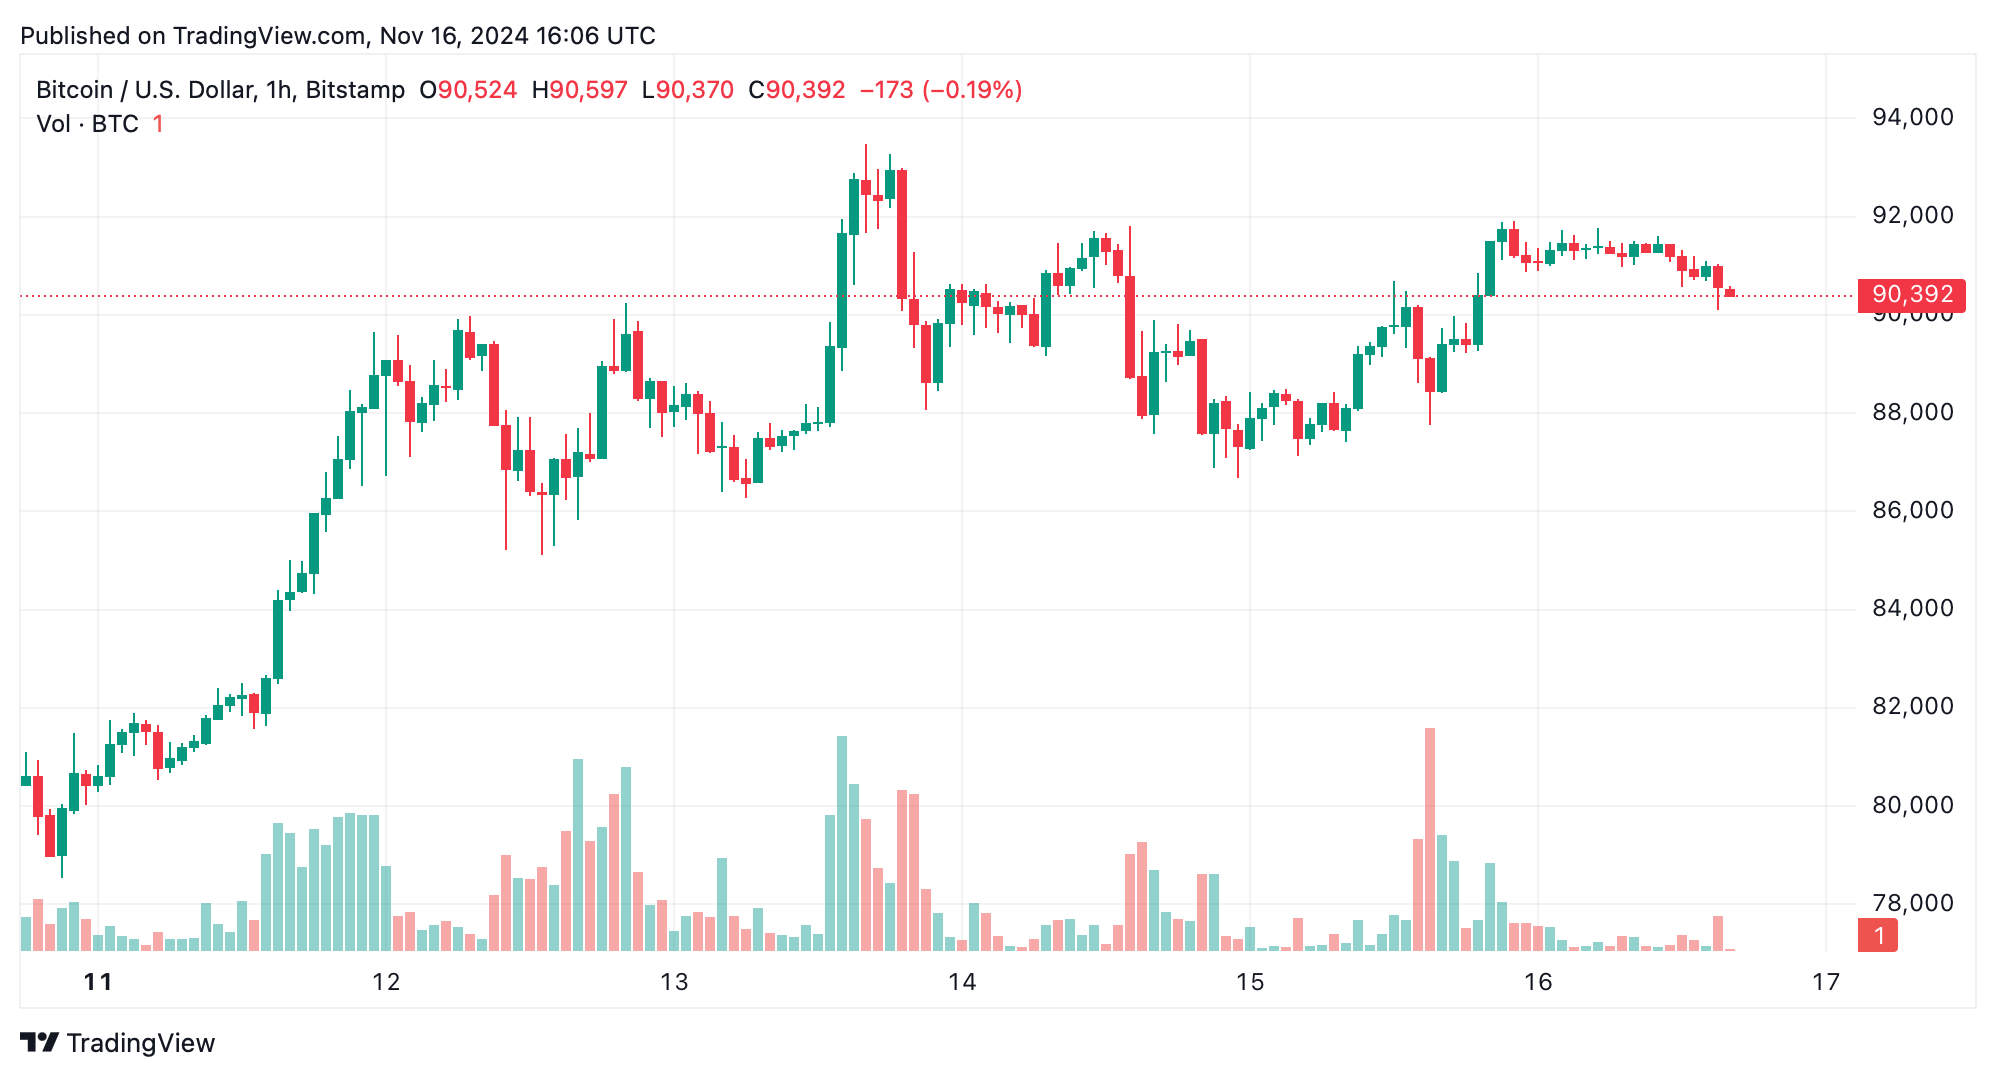
Bitcoin‘s hourly chart showcases a recent climb to $91,909, followed by a slight dip. Recent drops signal bearish movement, but the decline appears shallow, suggesting sellers might be running out of steam. With support holding around $91,000 and $90,000, and resistance sitting near $92,000, these levels are key to watch. Trading volume this weekend has dipped since the rally, signaling caution. A bounce near $91,000 could create an opportunity for a long trade targeting $92,000 or beyond.

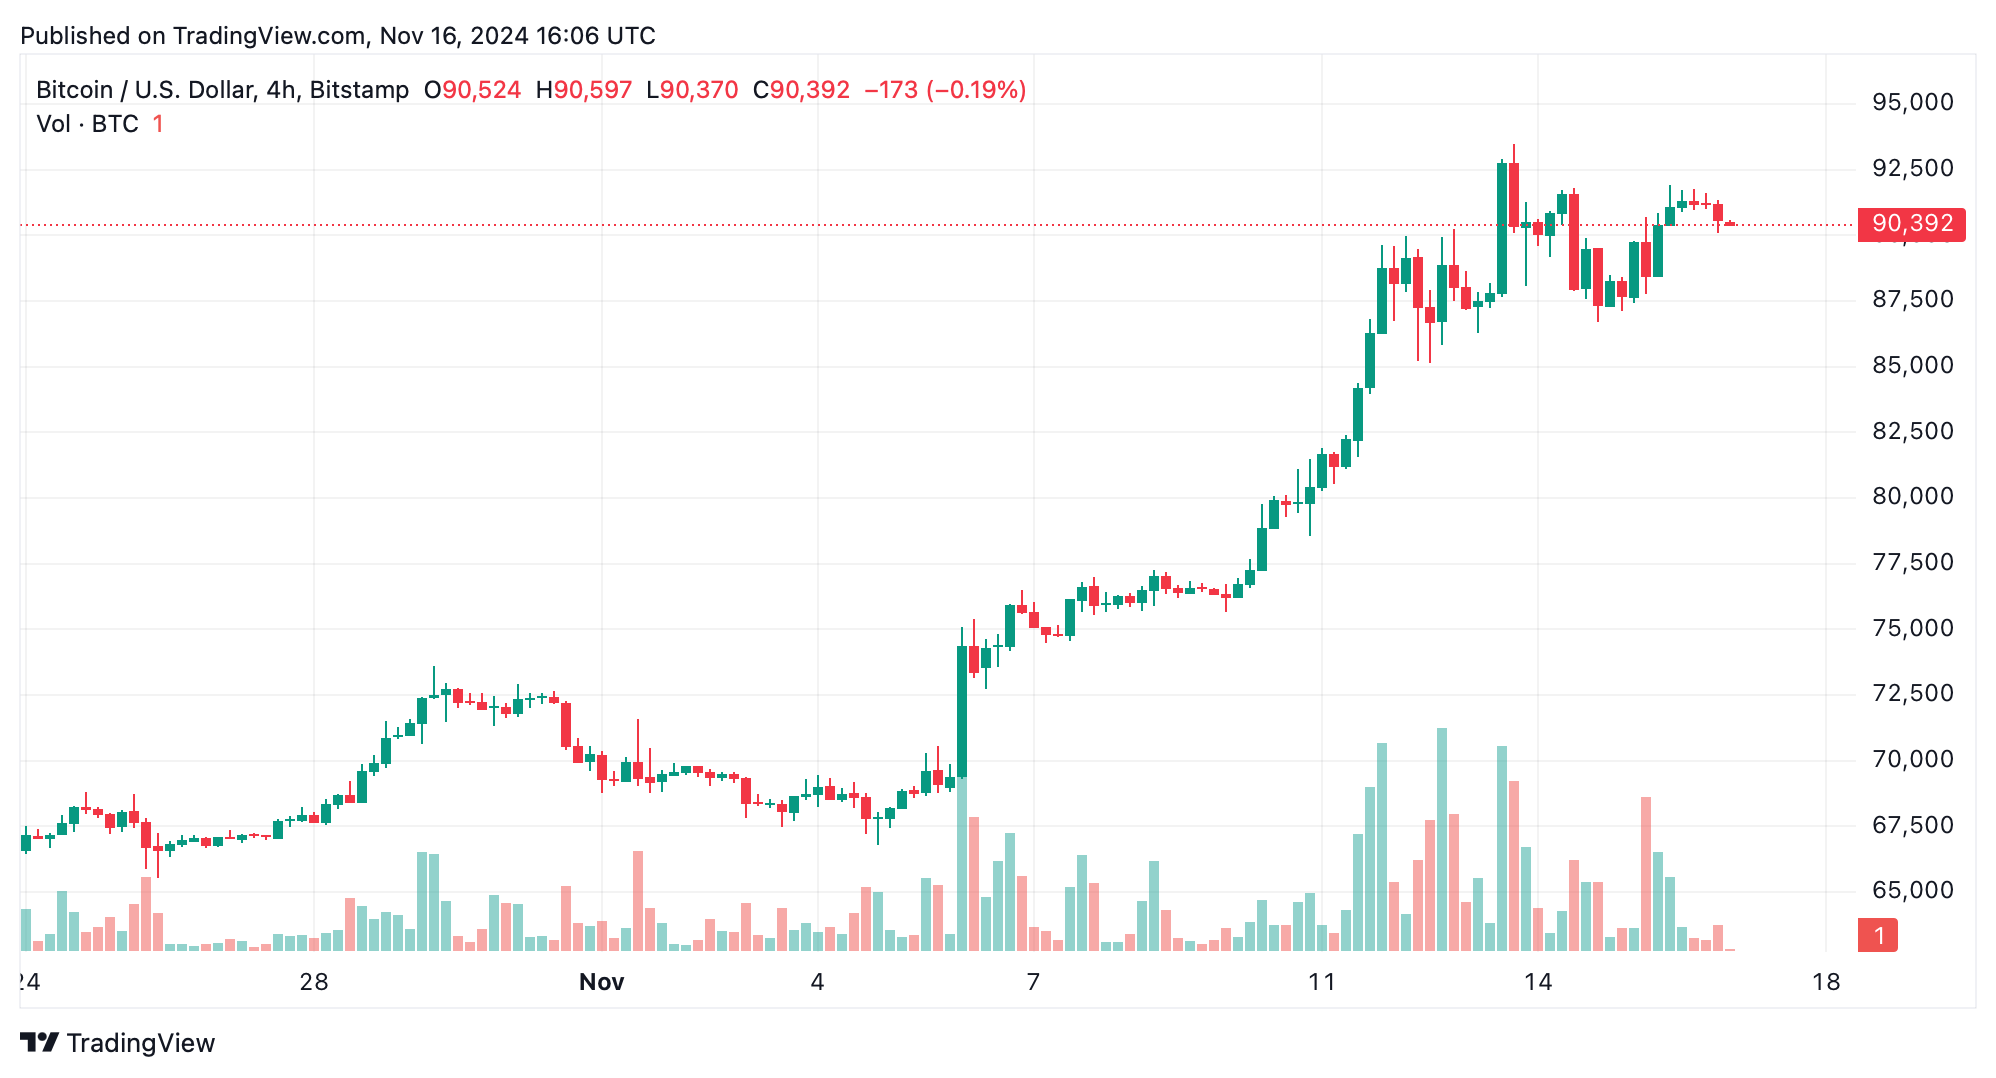
Zooming out to the 4-hour chart, the uptrend remains intact with a high of $93,483. While lower highs are forming, the pattern of higher lows sustains a positive outlook. Support at $90,000 and $88,000 offers attractive entry points, while resistance at $93,500 is the next major test. The recent drop in trading volume post-rally suggests a pause in the action, providing medium-term traders a chance to position themselves around $90,000 with tight stop-losses below $88,000. A breakout beyond $93,500 could pave the way for further gains.

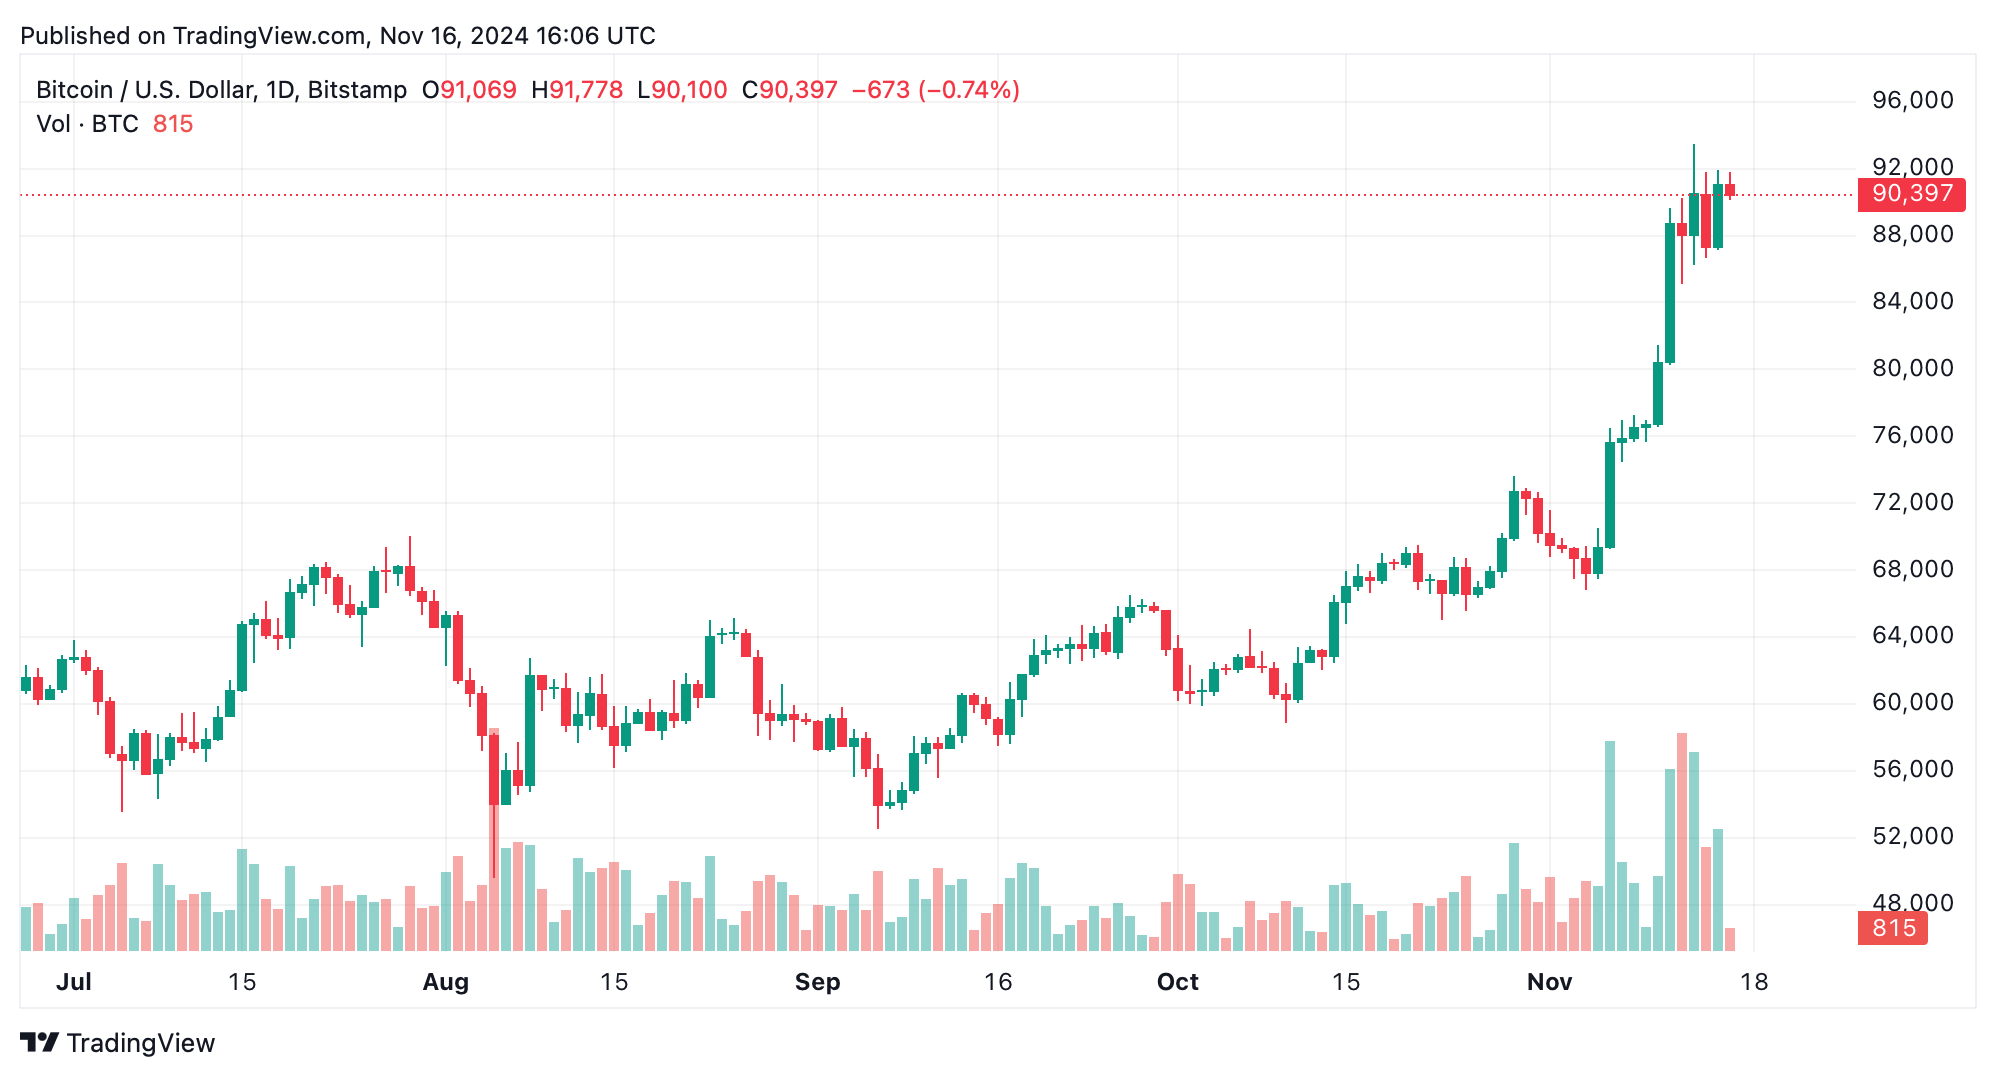
On the daily timeframe, bitcoin’s rally from $62,039 to $93,483 underlines a strong trend. The dip back to current levels aligns with natural trend behavior. Significant trading volume during the rally highlights market interest, but the current tapering indicates possible consolidation. Support at $85,000 serves as a safety net, while resistance at $93,500 and $95,000 offers targets for those looking to lock in profits. A sustained move above $90,000 could build momentum for a push toward $95,000.

Oscillators across the board paint a mixed picture. The relative strength index (RSI) at 75 and the commodity channel index (CCI) at 124 suggest overbought conditions, urging caution, while the moving average convergence divergence’s (MACD) bullish reading of 6,077 supports continued buying momentum. Moving averages (MAs), including the 10-period exponential moving average (EMA) at $84,995 and the 200-period simple moving average (SMA) at $64,569, confirm the broader positive trend. The overlap of short- and long-term MAs above the price hints at potential gains ahead.
Bitcoin’s multi-timeframe analysis inspires cautious optimism. Short-term traders should keep an eye on bounces around $91,000, while medium- and long-term strategies can capitalize on support zones at $90,000 and $85,000. With resistance zones at $93,500 and $95,000 offering profit targets, placing stop-losses below $88,000 is prudent to manage risks. Despite bitcoin’s current strength, traders should remain vigilant of macroeconomic trends and shifts in sentiment, as external factors continue to exert significant influence on the market.
Bull Verdict:
Bitcoin’s multi-timeframe strength, sustained support levels, and broader bullish structure suggest further upside potential. A breakout above $93,500 could ignite a rally toward $95,000 and beyond, providing traders with promising opportunities as long as support at $90,000 holds firm.
Bear Verdict:
While the trend leans bullish, BTC’s overbought indicators and tapering volume hint at exhaustion. Failure to hold support at $90,000 per bitcoin or a break below $88,000 per unit could trigger a deeper correction, giving bears a chance to take control in the short term.
Source:news.bitcoin.com


