

As of Sept. 23, 2024, ethereum is trading at $2,646, with an intraday price range of $2,531 to $2,684. Over the past 24 hours, ethereum has recorded a trading volume of $16.36 billion and a market capitalization of $318.56 billion. The cryptocurrency’s price is holding steady, reflecting a balanced market with mixed signals from technical indicators.
Ethereum
Ethereum’s (ETH) 1-hour chart reflects a recent rally from $2,525 on Sept. 21 to a peak of $2,687, followed by a slight consolidation in the $2,660–$2,680 range. This short-term pullback is accompanied by reduced volume, suggesting a potential for a breakout as traders await further movement. Key oscillators like the awesome oscillator and moving average convergence divergence (MACD) indicate a neutral stance, while the Stochastic oscillator signals that ethereum may be slightly overbought at this level.
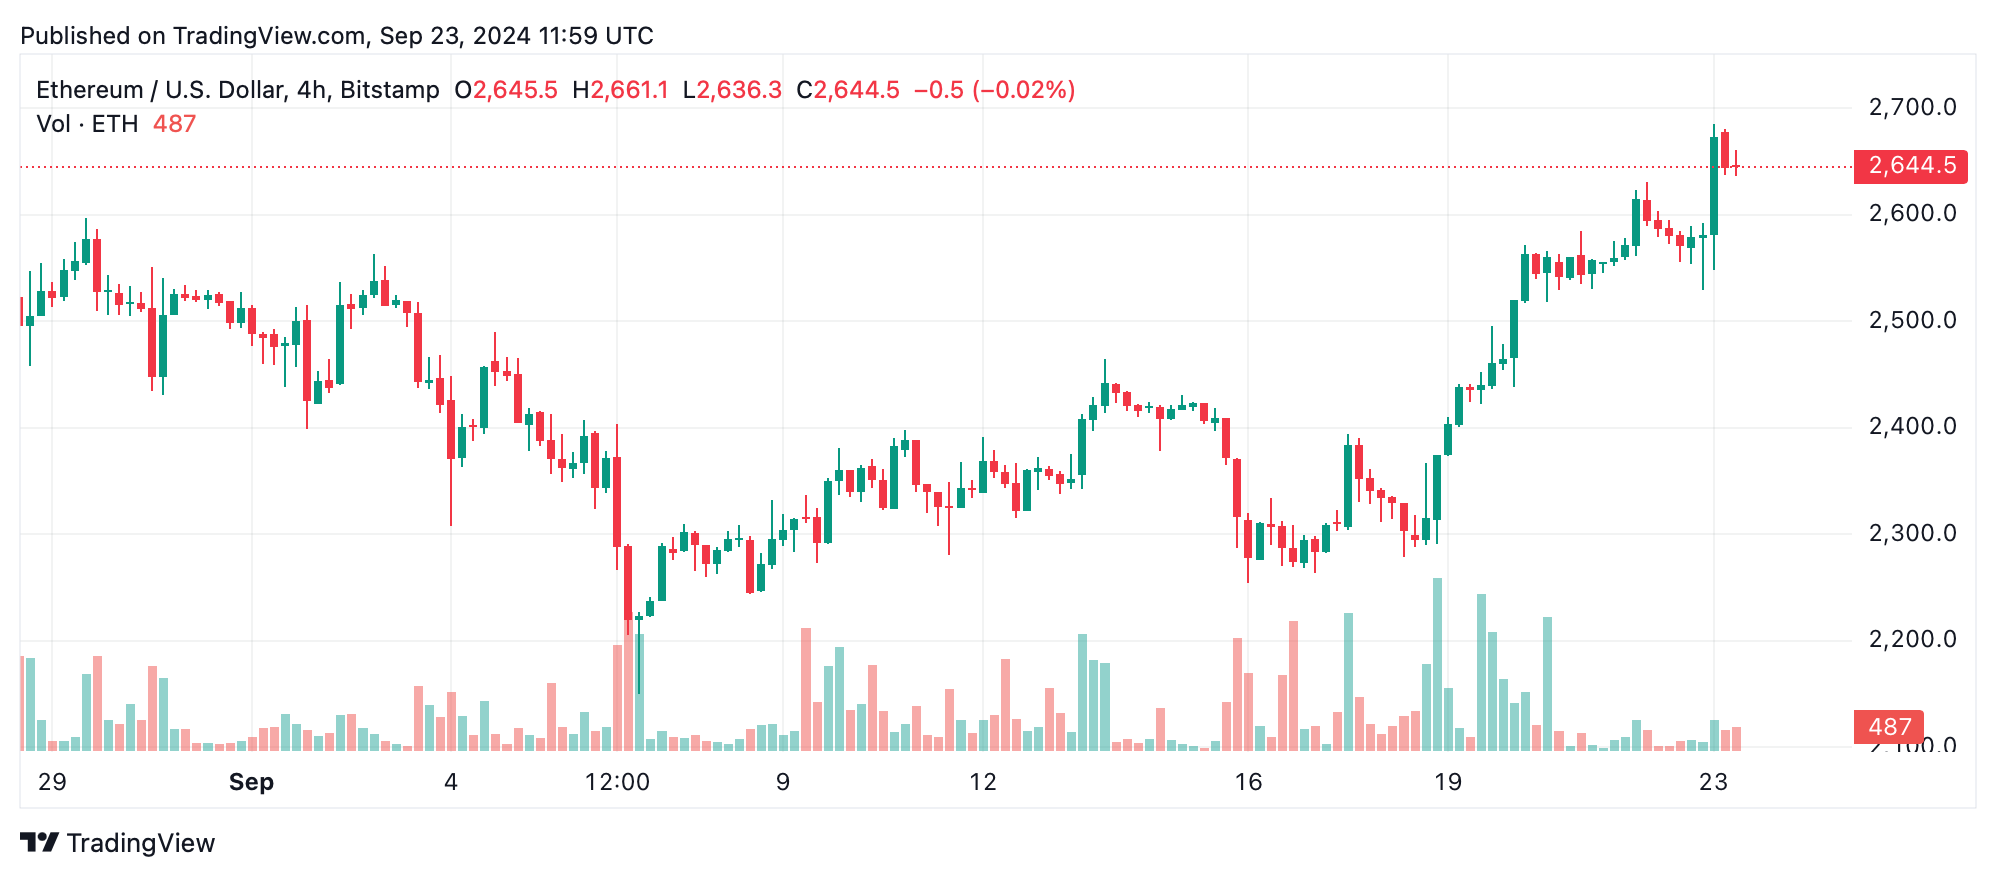
On the 4-hour chart, ethereum continues to demonstrate a steady uptrend since Sept. 18, when the price rebounded from $2,276. With resistance currently sitting near $2,687, ethereum is consolidating around $2,600. Lower trading volumes during this pullback hint at a period of accumulation, setting the stage for a potential test of the next resistance level, which lies between $2,750 and $2,800.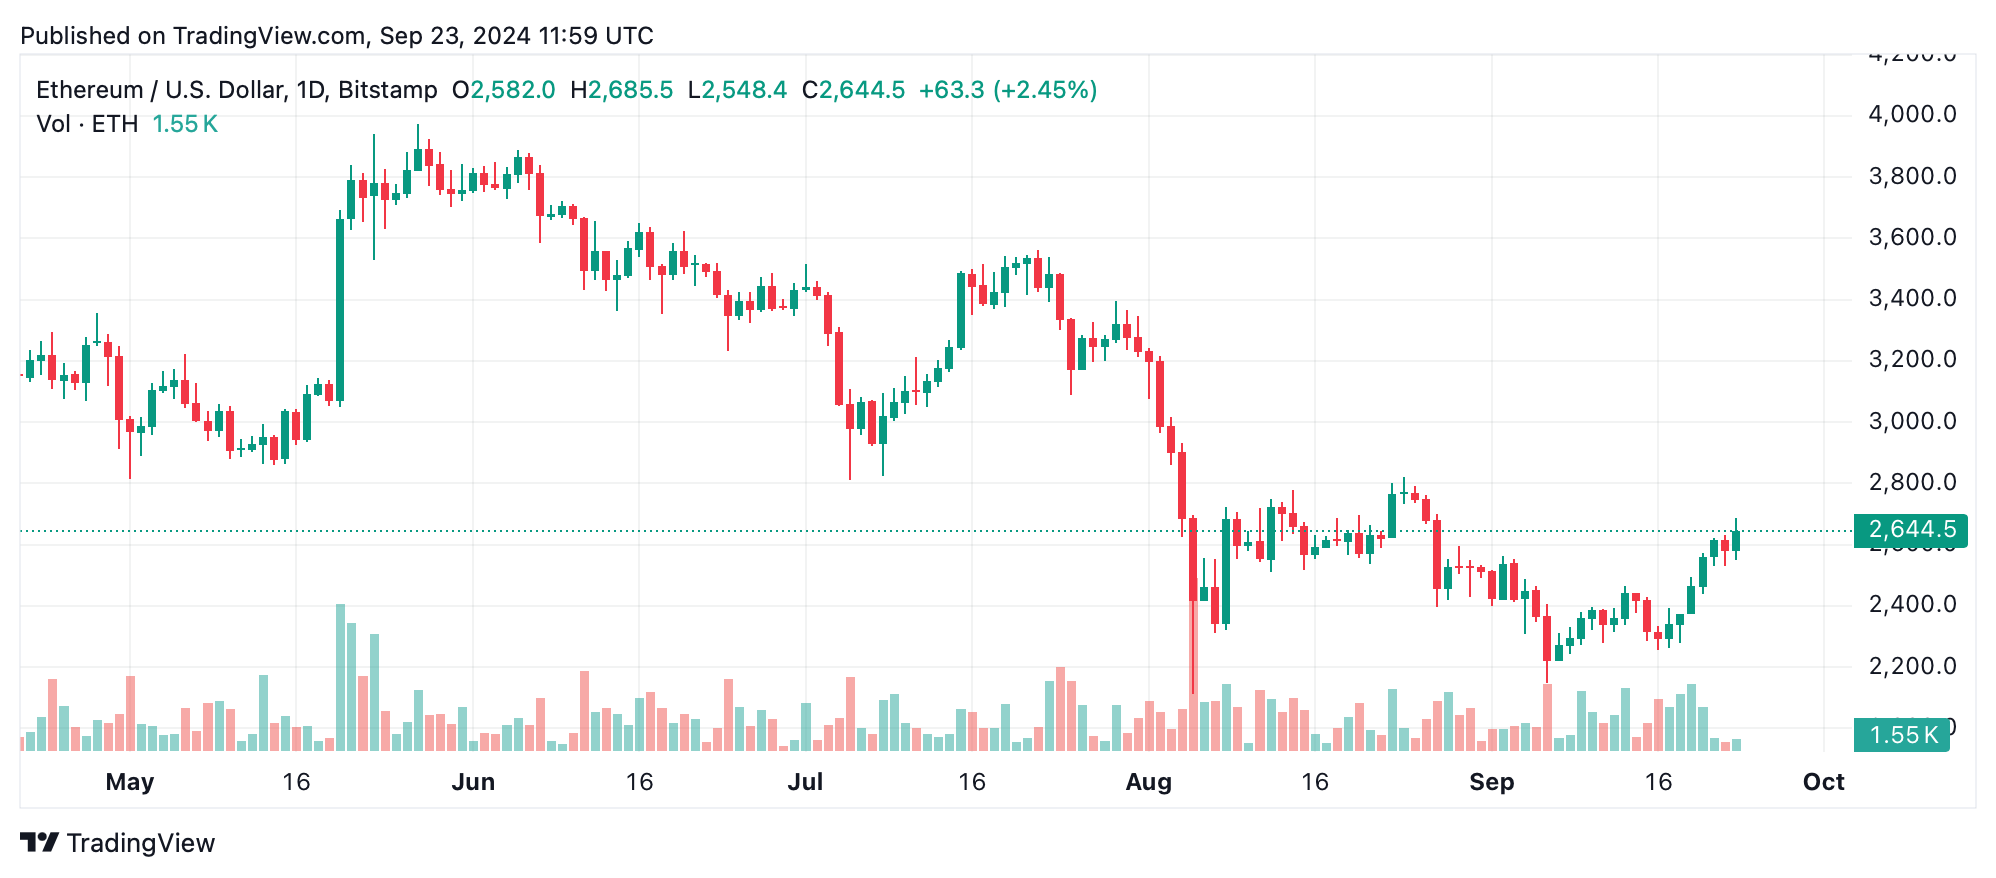
The daily chart shows that ethereum has rebounded from a recent low of $2,149 in mid-September, following a broader market sell-off. This recovery has taken the price back to the $2,600 range, where resistance at $2,687 remains intact. If ethereum retraces to the $2,500–$2,550 range, this could present a solid buying opportunity, given the strong support observed in previous retracements.
Oscillators present mixed signals, with the relative strength index (RSI) neutral at 60.2 and the commodity channel index (CCI) similarly neutral at 183.7. While the Stochastic oscillator suggests that ethereum is overbought, the MACD remains in neutral territory, indicating continued upward pressure. Momentum, however, may be waning slightly, as reflected in a neutral stance from the awesome oscillator.
Moving averages (MAs) provide a generally positive outlook, with short-term indicators such as the 10, 20, and 50-period exponential moving averages (EMAs) and simple moving averages (SMAs) all signaling bullish opportunities. However, the 100 and 200-period moving averages reflect a bearish divergence, as the long-term trends suggest resistance above $2,800. These mixed signals indicate that while ethereum may push higher in the short term, it could face stronger headwinds as it approaches those levels.
Bull Verdict:
Ethereum remains in a bullish consolidation phase, supported by strong buying signals from short-term moving averages and key technical indicators like the MACD. A breakout above the $2,687 resistance could see the price push toward $2,750 and beyond, with momentum favoring continued upward movement. As long as ethereum holds above $2,600, the outlook remains optimistic for further gains.
Bear Verdict:
While ethereum has shown resilience above $2,600, bearish signals from longer-term moving averages and oscillators such as the Stochastic and Momentum indicate potential overbought conditions. A failure to break above $2,687 or a breakdown below $2,600 could trigger a deeper correction, with a possible retest of the $2,500 support level. In this scenario, caution is advised as bearish pressure may increase.
Source: cryptonews.com