- Santiment recently tweeted that the number of active addresses for BTC has climbed back to 960K.
- BTC was able to flip the key resistance level at $26,960 into support over the past 24 hours.
- Technical indicators suggested that BTC’s price would break above $27,480 in the next 24-48 hours.
Address activity for Bitcoin (BTC) has started to pick up again after concerningly low levels in May. In a tweet published earlier today, the blockchain intelligence firm Santiment noted that the number of active addresses for BTC climbed back to 960K for the first time since 3 May 2023.
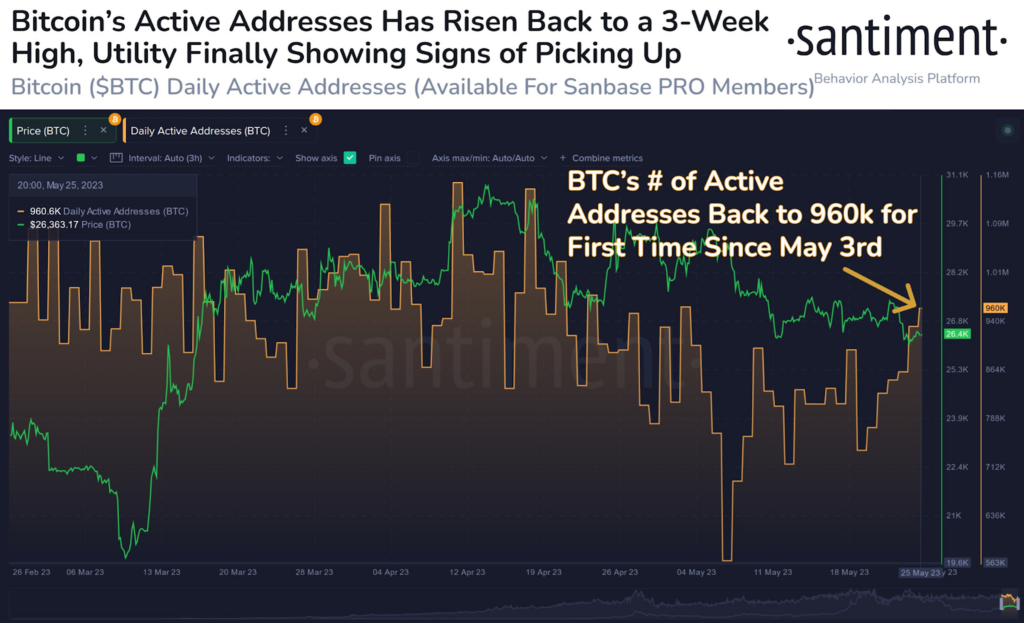
The recent recovery in the on-chain metric marks a 3-week high as BTC’s utility shows signs of picking up. According to Santiment, increasing utility is necessary for crypto assets to enjoy sustained rallies.
At press time, the market leader was changing hands at $27,218.63 according to CoinMarketCap. This was after the crypto’s price printed a 1.84% gain over the past 24 hours. The recent increase in BTC’s price flipped its weekly performance into the green. As a result, BTC’s weekly price performance stood at +0.44%.
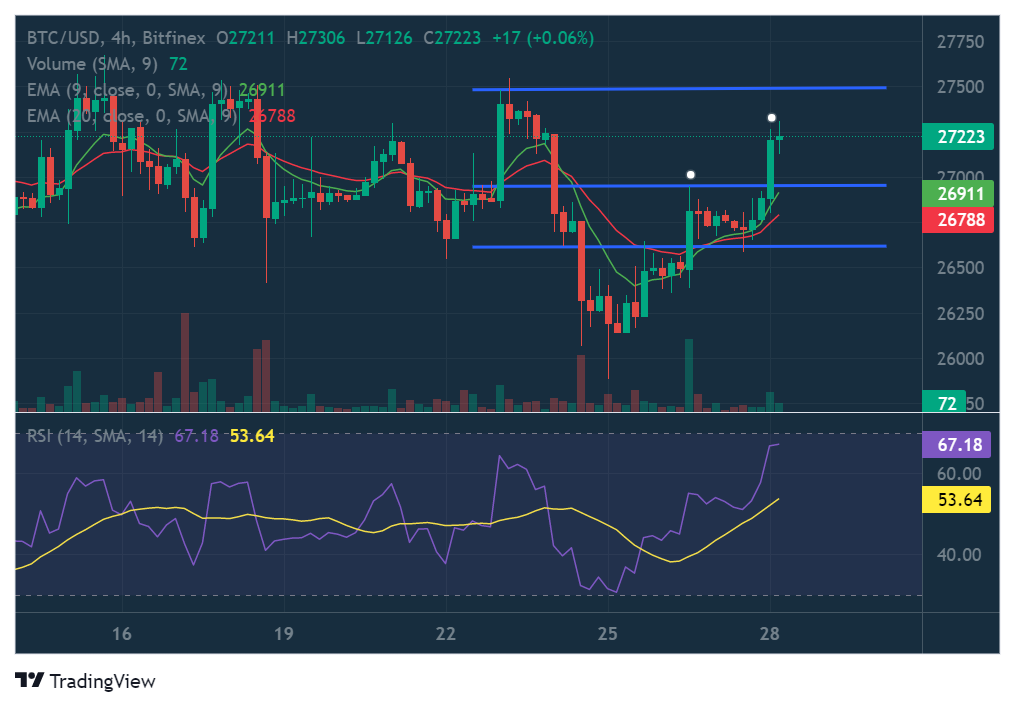
BTC’s price had flipped the $26,960 resistance level into support over the past 24 hours, and continued to trade above this mark at press time. Technical indicators on BTC’s 4-hour chart suggested that the crypto’s price would attempt to do the same with the next resistance level at $27,480 in the next 24-48 hours..
The 9 EMA line on the 4-hour chart had recently crossed bullishly above the 20 EMA line – signalling that BTC’s price had entered into a short-term bullish cycle. In addition to this, the shorter EMA line was bullishly breaking away from the longer EMA line.
The RSI indicator on the 4-hour chart was also flagging bullish at press time, with the RSI line trading above the RSI SMA line. Furthermore, the RSI line was sloped positively towards overbought territory, which was another bullish sign.
Source:coinedition.com